The Best Facebook Ads Dashboard for Real Estate Agents and Brokerages
Real estate agents and brokerages need a Facebook Ads dashboard that answers one question fast: how much does each listing or lead cost, and is it getting cheaper or more expensive. Most agents are not marketers, so the right tool puts cost per lead, lead volume, and spend in plain view without making anyone learn Ads Manager. Below is what to look for, in order, so the dashboard works for a busy agent, a team lead reviewing the office, and a broker who just wants to know the money is working. The goal is a real estate ad reporting tool that shows the numbers a property business actually acts on.
1. Cost per lead, front and center
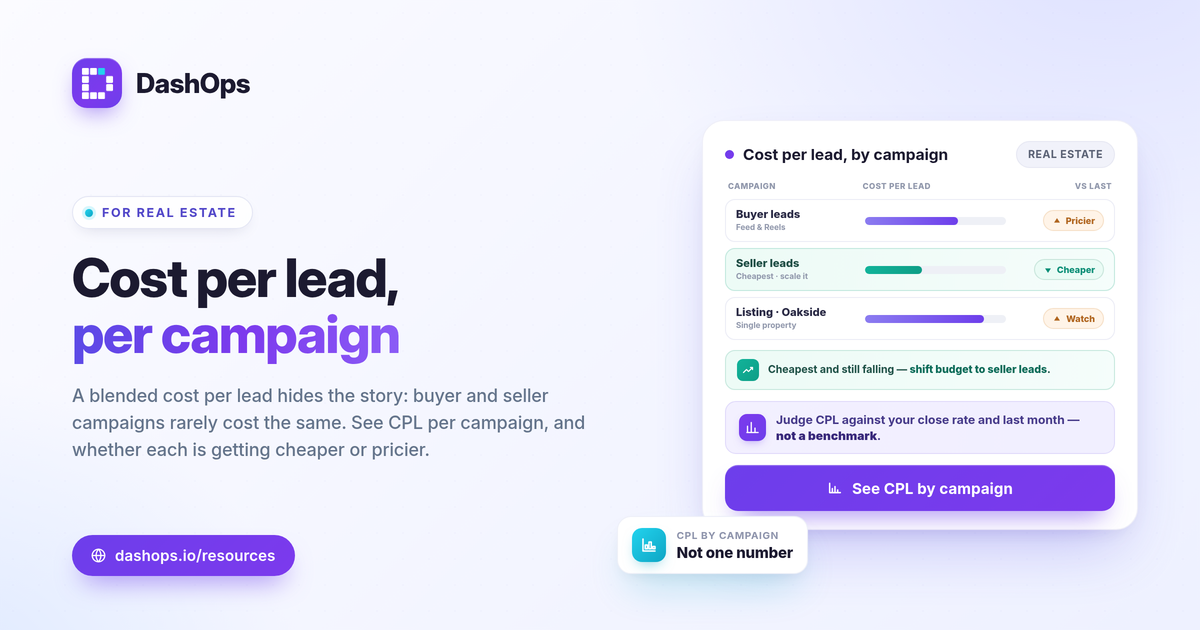
For most real estate campaigns the result is a lead, not a sale, so cost per lead is the number that matters most. A good real estate cost per lead dashboard shows it without you doing math.
- The formula is simple: cost per lead = spend / leads. The dashboard should calculate it for you and update as spend and lead counts change.
- Show it per campaign. A buyer-lead campaign and a seller-lead campaign rarely cost the same. Seeing them side by side tells you where the budget is working.
- Compare it to last period. A single cost per lead number means little on its own. The question is whether this week or month is cheaper or more expensive than the last, which a period-over-period comparison answers directly.
Judge “good” against your own numbers, not a universal benchmark. What a buyer lead is worth to you, your typical close rate, and last month’s cost per lead are the only fair reference points. For more on framing this, see cost per lead vs lead quality.
2. Lead capture and export, not just charts
Real estate runs heavily on Meta Instant Forms, where a prospect submits their details inside Facebook or Instagram without leaving the app. The dashboard has to capture those leads, not just count them.
- Pull leads into one place. Instant Form submissions should land where you can see name, contact, and which campaign drove them.
- Export to CSV or Excel. Agents follow up in a CRM or a spreadsheet, so a clean export matters more than a pretty chart.
- Mind the 90-day window. Meta only lets you download Instant Form leads directly from the Page for a limited window, about 90 days, after which leads must be retrieved through the API or a connected tool. A dashboard that captures leads as they come in protects you from losing older ones.
If lead handling is the core of your work, the Meta Instant Forms lead capture guide and the real-estate-specific Facebook lead ads reporting for real estate post go deeper.
3. Reporting a non-marketer can read
Most agents and brokers do not want to learn Ads Manager. The dashboard should make sense to someone who has never opened it.
- Plain KPIs, plainly labeled. Spend, leads, cost per lead, and reach should read like a one-line answer, not a data dump.
- A trend line, not a wall of tables. A simple chart showing leads or cost per lead over time tells the story faster than a grid of figures.
- One screen, not ten tabs. The fewer clicks between opening the tool and seeing the answer, the more often it actually gets used.
This is the practical difference between raw Ads Manager and a reporting layer. If you are weighing the two, Facebook Ads Manager vs a reporting dashboard lays out when each one fits.
4. The KPIs that matter for property campaigns
You do not need every metric Meta returns. For real estate lead gen, a short list does the work.
- Spend and leads: what you put in and what you got out.
- Cost per lead: the efficiency number you steer by.
- Reach and frequency: how many people saw the ad and how often. Rising frequency with flat leads is an early sign of fatigue.
- CTR and CPM: CTR = clicks / impressions and CPM = spend / impressions times 1000. These tell you whether the creative is landing and whether your audience is getting more expensive to reach.
For a fuller walkthrough of what each one means and why, the Meta Ads KPIs to track post is the reference. If you run sales-driven campaigns alongside lead gen, ROAS vs CPL vs CPA explained clears up which to use when.
5. Breakdowns to stop wasting spend
Property buyers and sellers cluster by area, age, and where they scroll. Breakdowns show you where the budget is earning its keep.
- Age and gender. A demographic breakdown shows which segments actually submit forms, so you can shift budget toward them.
- Placement. Comparing Feed, Stories, and Reels shows where your cost per lead is lowest, so you stop paying for placements that do not convert.
- Top campaigns and spend pacing. A quick view of your best campaigns and whether you are on track to spend the budget keeps month-end surprises away.
These breakdowns are also how you read fatigue early: when frequency climbs and a placement that used to be cheap gets expensive, it is time to refresh the creative.
6. Multiple listings, agents, or offices in one view
A single agent might run a handful of campaigns. A brokerage runs many, sometimes across separate ad accounts for separate agents or markets. Brokerage Meta Ads reporting should roll all of that up.
- One dashboard across accounts. Managing multiple Meta ad accounts in one place beats logging into each separately.
- Per-account and combined views. A broker wants the office total; a team lead wants one agent’s numbers. Both should be one click apart.
- Shareable, read-only access. A public read-only share link or a simplified client portal lets an agent or a partner see their own results without touching the settings.
If you manage several books of business, managing multiple Meta ad accounts covers the workflow.
7. Reports that send themselves
A brokerage owner should not have to ask for an update. The dashboard should deliver one.
- Scheduled email digests. A weekly summary of spend, leads, and cost per lead, sent automatically, keeps everyone informed without a meeting.
- PDF, Excel, and CSV exports. For a board review or a quick record, a clean export is enough.
- White-label reports. A brokerage reporting to franchise owners or partners can put its own brand on the report. Growth includes white-label Lite; Enterprise adds white-label Full with custom domains. See white-label client reporting for how that works.
DashOps is built to be exactly this kind of real estate lead dashboard: connect your Meta ad accounts and see cost per lead, lead volume, demographic and placement breakdowns, and period-over-period trends in one place, with Instant Form capture and CSV or Excel export so no lead slips past the 90-day window. Starter is view-only reporting; Growth and Enterprise add the full Meta module. See what each plan includes on the pricing page, and the help center covers connecting an account and exporting leads.
The takeaway: pick the dashboard that shows cost per lead by campaign and exports your leads cleanly, because for real estate those two things decide whether the ad spend was worth it.
Frequently asked questions
What should a Facebook Ads dashboard show real estate agents first?
How do I keep Facebook lead ads leads from disappearing?
Can a brokerage report on multiple agents or offices in one dashboard?
See it in your own dashboard
DashOps brings Meta Ads reporting, campaign management, and white-label client portals into one place. Pick the plan that fits how you run ads.