Cost Per Lead vs Lead Quality: Which Meta Ads Metric Should You Optimize For
A low cost per lead feels like a win, but cost per lead vs lead quality is the comparison that actually decides whether the money worked. Cost per lead (CPL) measures how cheaply you collected a contact. Lead quality measures whether that contact becomes a customer. Optimize only for the first and you can drive CPL down while quietly filling your pipeline with people who never buy. The fix is not to pick one metric. It is to report on both, so a cheap lead that closes nothing stops hiding inside an attractive average. Here is how to think about each, and how to show them together.
What cost per lead actually tells you
Cost per lead is a clean efficiency metric, and Meta reports it natively. The formula is simple:
- CPL = spend / leads. If you spent on a campaign and collected leads through an Instant Form or a landing page, divide one by the other.
CPL answers a narrow question: how much did it cost to get someone to raise their hand. That is genuinely useful for spotting waste between campaigns, ad sets, and creatives. A campaign with a CPL several times higher than the rest is worth investigating. So is one where CPL is climbing week over week against a flat budget.
What CPL does not tell you is whether those hands belong to people who will ever buy. A form that asks for almost nothing and offers a tempting incentive will produce a low CPL and a lot of weak leads. That is the trap.
Why a low CPL can quietly waste budget
Cheap leads are only cheap if they convert. When they do not, a falling CPL is actively misleading, because it points the optimizer toward the wrong audiences and offers.
Consider two ad sets for a demo lead-gen account, Northwind Solar:
- Ad set A: lower CPL, but most leads never reply or do not qualify.
- Ad set B: higher CPL, but a meaningful share book a call and become customers.
If you optimize on CPL alone, you shift budget to A and starve B. Spend looks more efficient on the surface while real results drop. This is the core of CPL optimization done badly: you are optimizing for the cost of a contact, not the value of a customer. Meta’s algorithm will happily find you the cheapest form-fills available, and the cheapest form-fills are often the least serious.
What lead quality means and how to measure it
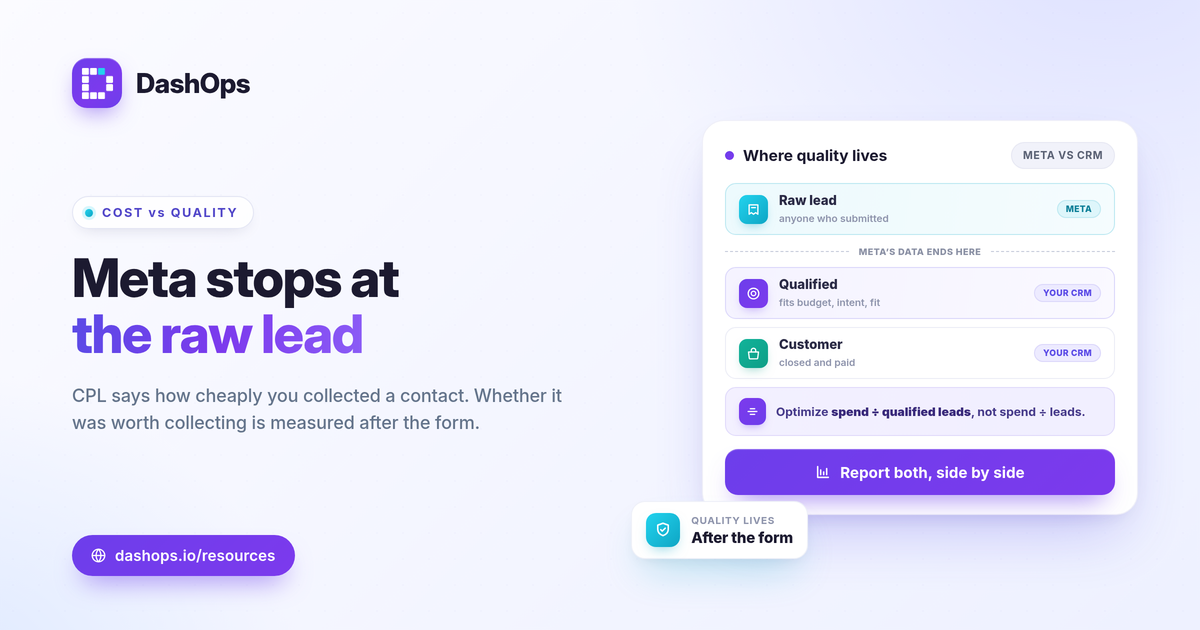
Lead quality is not a single Meta field. It lives in what happens after the form is submitted: did the lead reply, qualify, book, and close. To measure it you need to connect Meta’s lead data to your own sales outcomes.
A practical way to define the stages:
- Raw lead. Anyone who submitted the form. This is what Meta counts.
- Contactable lead. Real contact details, reachable, not spam or a misclick.
- Qualified lead. Fits your criteria: budget, location, intent, or whatever defines a real prospect for you.
- Customer. Closed and paid.
Meta lead quality metrics stop at the raw lead. Everything past that comes from your follow-up. The mechanics are straightforward: export your Instant Form leads, push them into your CRM, and tag each one with its outcome. One platform fact worth planning around: Meta only lets you download Instant Form leads directly from the Page for a limited window, about 90 days, after which you have to pull them through the API or a connected tool. If you wait too long to export, the raw data you need for quality reporting can age out.
The metric that combines both: cost per qualified lead
The number that resolves the cost per lead vs lead quality tension is cost per qualified lead.
- Cost per qualified lead = spend / qualified leads.
This rewards campaigns that bring in fewer but better leads and penalizes ones that flood you with cheap noise. If ad set B above costs more per raw lead but far less per qualified lead, the spend decision flips, and correctly so.
You can extend the same logic all the way down:
- Cost per booked call = spend / booked calls.
- Cost per customer (CPA) = spend / customers.
- Pipeline or revenue per dollar spent, once deals close.
Each step ties Meta spend closer to money, which is what the person reading the report cares about. For how these efficiency metrics relate, ROAS vs CPL vs CPA explained walks through where each one fits.
How to judge whether a CPL is good
There is no universal CPL that is automatically good. A figure that is healthy for a low-ticket offer can be a disaster for a high-ticket one, and the reverse. Judge yours against three things you control:
- Your economics. What a customer is worth and what close rate you actually see. Work back from there to the most you can pay per lead and still profit.
- Your own trend. Compare this period to the last one. A CPL rising against a stable qualified-lead rate is a real warning. A CPL rising while qualified leads rise faster may be fine.
- Your quality stages. A CPL only means something next to the qualification rate behind it.
This is why period-over-period comparison matters more than any single snapshot. If you want benchmark context for sanity-checking, facebook ads cost per lead benchmark explains how to use ranges without anchoring on them.
How to report on cost per lead and lead quality together
The goal of lead quality reporting is one view where cost and quality sit next to each other, so neither hides the other. A workable layout:
- Lead volume and CPL from Meta, by campaign, with the period-over-period change.
- Qualified leads and cost per qualified lead, fed from your CRM outcomes.
- The qualification rate, qualified divided by raw, so a falling CPL with a falling qualification rate is visible at a glance.
- Trend over time, not just this month’s totals, since quality problems show up as a drift.
Pulling Meta’s spend and lead counts together with your sales outcomes is the part that takes setup, but it is also the part that keeps cheap, useless leads from passing as a win. For a fuller list of metrics worth showing, see Meta Ads KPIs to track, and for how a dedicated view differs from the native UI, Facebook Ads Manager vs reporting dashboard.
DashOps reads your Meta lead volume, CPL, and the rest of your KPIs across every connected ad account in one dashboard with period-over-period comparison built in, and lets you export Instant Form leads to CSV or Excel so you can tag outcomes in your CRM and report on qualified leads, not just raw ones. White-label client reports keep that view clean for the people you answer to. See what each plan includes on the pricing page, and the help center covers connecting accounts and exporting leads.
Report cost per lead and lead quality side by side, and a cheap lead that never closes can no longer pass for a good one.
Frequently asked questions
Is cost per lead or lead quality more important?
How do you measure Meta lead quality if Facebook only reports CPL?
How do you report on cost per lead vs lead quality together?
See it in your own dashboard
DashOps brings Meta Ads reporting, campaign management, and white-label client portals into one place. Pick the plan that fits how you run ads.