Meta Ads Benchmarks for Ecommerce Brands: ROAS, CPM and Purchase Cost by Vertical
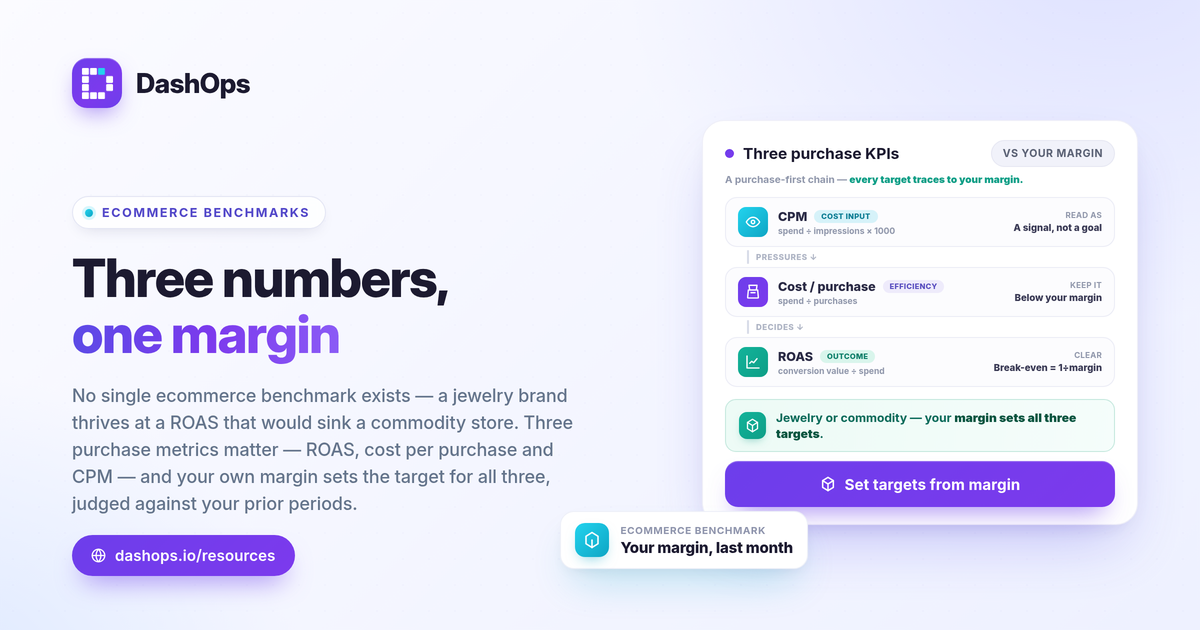
There is no single Meta Ads benchmark for ecommerce that tells you whether your numbers are good. ROAS, cost per purchase and CPM swing widely by product, margin, audience, season and creative, so a figure that looks healthy for one store would be a loss for another. The honest way to read ecommerce Facebook Ads benchmarks is to start from your own profit margin and your own prior periods, then judge each metric against those. This guide covers the three purchase-oriented KPIs that matter most for ecommerce, the real formulas behind them, what moves each one, and how to set targets you can actually defend.
Why one universal ecommerce benchmark does not exist
Published “average ROAS” or “average cost per purchase” numbers feel reassuring, but they hide more than they reveal. Real performance varies by industry, objective, audience, average order value and season, which is why two stores running identical budgets can post very different results and both be doing fine.
A few factors move these metrics on any given day:
- Auction demand. More advertisers competing for the same audience pushes CPM up, which drags on cost per purchase and ROAS.
- Audience and objective. Prospecting cold audiences costs more per purchase than retargeting warm ones. A traffic objective and a purchase objective produce different numbers entirely.
- Season. Costs typically rise heading into peak retail periods as competition increases.
- Average order value and margin. A high-AOV, high-margin product can thrive at a ROAS that would bankrupt a low-margin store.
- Creative. Strong creative lowers cost per result; tired creative quietly raises it.
Because all of these differ by business, the most reliable Meta Ads benchmark for ecommerce is your own history. Period-over-period comparison answers the question that actually matters: is this period better or worse than the last one, holding your business constant.
ROAS: judge it against break-even, not an average
ROAS is the headline ecommerce metric, and the formula is simple:
- ROAS = conversion value / spend. A ROAS of 3 means three dollars of tracked revenue for every dollar spent.
The number that decides whether a ROAS is “good” is your break-even ROAS, which comes straight from your margin:
- Break-even ROAS = 1 / profit margin. A 40 percent profit margin means you break even at a ROAS of 2.5. Anything above that is profit; anything below loses money.
This is why an ecommerce ROAS benchmark borrowed from another store is close to useless. A jewelry brand with fat margins can be wildly profitable at a ROAS that would sink a low-margin commodity store. Calculate your own break-even first, set your target comfortably above it, then watch the trend. For a deeper walk-through of the calculation, see calculate break-even ROAS for ecommerce and the broader explainer on what is a good ROAS for ecommerce Facebook Ads.
One caution on ROAS specifically: Meta reports its own attributed conversions, and iOS privacy changes cause undercounting, so platform ROAS can read lower than what your store actually earned. Treat Meta-native ROAS as a consistent internal yardstick for comparing campaigns and periods, and reconcile against your store’s real sales separately.
Cost per purchase: compare it to your margin
Cost per purchase is the efficiency metric that ties spend directly to orders:
- Cost per purchase = spend / purchases. Sometimes shown as cost per result when the optimization event is a purchase.
The benchmark for cost per purchase is not an industry table; it is your contribution margin per order. If you net a certain amount on each sale after product and fulfillment costs, your cost per purchase has to sit comfortably below that figure for the campaign to make money. A cost per purchase that looks high in absolute terms can be perfectly healthy for a high-AOV product, and a low one can still lose money on thin margins.
As you scale spend, cost per purchase usually drifts up because you reach beyond your most responsive buyers. That is normal. What matters is whether it stays inside your margin and how it trends period over period, not whether it matches a number you read somewhere.
CPM: a cost input, not a scorecard
CPM measures what you pay to be seen, not what you earn:
- CPM = spend / impressions times 1000. It is the price of a thousand impressions.
CPM is best read as a leading indicator rather than a goal. A rising CPM raises the bar your conversion rate has to clear to hold cost per purchase steady. CPM moves with auction demand, audience size, placement mix and season, so a jump often reflects market conditions rather than anything broken in your account. Before reacting, check whether ROAS and cost per purchase actually moved with it. For the mechanics, see Facebook Ads CPM benchmark and why did my CPM jump.
How to set targets you can defend
Pull the three metrics together into a simple, honest framework:
- Start from margin. Compute break-even ROAS and your contribution margin per order. These are your floors.
- Read your own history. Use period-over-period comparison to see the real trend in ROAS, cost per purchase and CPM for your account.
- Set targets above break-even. Aim for a ROAS and cost per purchase that leave room for profit, then hold campaigns to that.
- Use breakdowns to find waste. Demographic and placement breakdowns show which age, gender and placement segments deliver efficient purchases and which quietly drain budget.
- Watch frequency for fatigue. Rising frequency alongside a climbing cost per purchase is a sign creative is wearing out, not that the channel is broken.
This adaptive, purchase-first view is exactly how ecommerce reporting should work. For the full metric list, see the Meta Ads KPIs to track, and for how ROAS, CPL and CPA differ across business models, see ROAS vs CPL vs CPA explained.
DashOps gives ecommerce stores adaptive purchase KPIs, ROAS and cost per purchase with period-over-period comparison built in, plus demographic and placement breakdowns and frequency as a KPI, so you benchmark against your own history instead of a number that does not fit your margin. It reports Meta-native figures across one or many ad accounts in a single dashboard, which is faster than rebuilding the same view in Ads Manager each week, and white-label client reports keep the story clean for stakeholders. See what each plan includes on the pricing page, and the help center covers setup.
The most useful ecommerce benchmark is the version of your own account from last month, measured against your margin.
Frequently asked questions
What is a good ROAS for ecommerce Facebook Ads?
How do I benchmark my own cost per purchase?
Why do ecommerce Meta Ads benchmarks vary so much?
See it in your own dashboard
DashOps brings Meta Ads reporting, campaign management, and white-label client portals into one place. Pick the plan that fits how you run ads.