Whatagraph Alternative for Meta Ads Reporting: A Side by Side Feature and Pricing Breakdown
If you run only Meta Ads, the question behind looking for a Whatagraph alternative for Meta Ads is usually simple: am I paying for cross-channel breadth I do not use, when what I want is deeper Facebook and Instagram reporting. Whatagraph is built as a multi-channel reporting suite that pulls many data sources into one layout. A Meta-specialized dashboard takes the opposite path: fewer channels, more depth on the metrics and breakdowns Meta actually returns, usually at a lower entry price. This post compares the two approaches on capability, exports, white-label, and pricing model, so you can match the tool to how you actually work.
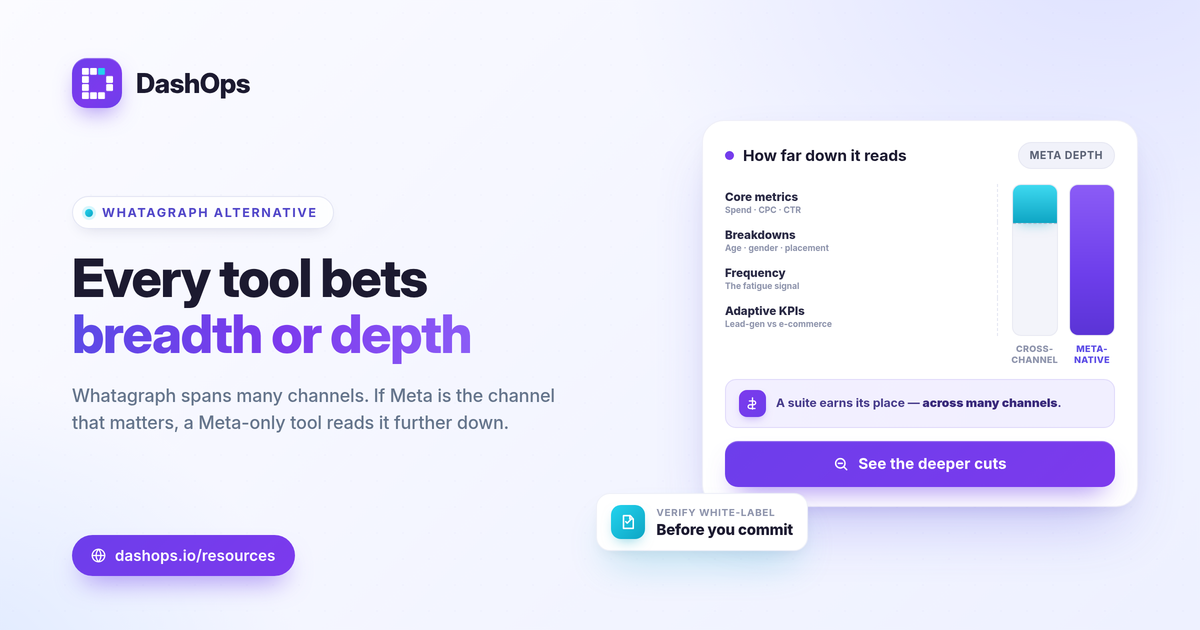
Two different bets: cross-channel suite vs Meta-only depth
Whatagraph positions itself as a cross-channel reporting platform. The pitch is consolidation: connect Meta, Google, LinkedIn, analytics, and more, then assemble them into one report. That is genuinely useful if you report across many platforms for many clients.
The trade-off is that breadth spreads attention. When a tool covers dozens of sources, the Meta view tends to surface the common metrics rather than the deeper Meta-native cuts. If Facebook and Instagram are your only paid channels, you are paying for connectors and a multi-source builder you will rarely open.
A Meta-specialized dashboard like DashOps makes the other bet. It reads one platform deeply: 17 or more Meta KPIs, demographic and placement breakdowns, frequency, top campaigns, and spend pacing, all with period-over-period comparison built in. For a single-channel advertiser, that depth is the point.
What each approach covers for Meta Ads reporting
Use this as a way to judge fit, not a scorecard. Always confirm current details on each vendor’s own pricing and feature pages, since plans change.
| Capability | Cross-channel suite (Whatagraph style) | Meta-specialized dashboard (DashOps) |
|---|---|---|
| Channel scope | Many sources: Meta, Google, LinkedIn, analytics, and more | Meta only: Facebook and Instagram Ads |
| Meta KPI depth | Core metrics, breadth over depth | 17 or more KPIs with period-over-period comparison |
| Breakdowns | Varies by source | Age, gender, and placement breakdowns |
| Adaptive KPIs | Generic across channels | Lead-gen vs e-commerce KPIs adapt automatically |
| Lead capture | Connector-dependent | Meta Instant Forms capture with CSV and Excel lead export |
| Exports | Report exports | Native PDF, Excel, and CSV exports |
| White-label | Available | Lite on Growth, Full with custom domains on Enterprise |
| Pricing model | Often per data source or seat | Per ad account |
The honest summary: if you report across many channels, a suite earns its place. If Meta is the channel that matters, a dashboard built only for Meta gives you cuts a generalist tool rarely exposes.
Where Meta-native depth changes the report
A few capabilities are hard to get from a generalist layout, and they are where the Whatagraph vs DashOps decision usually turns.
- Demographic and placement breakdowns. Seeing spend and results split by age, gender, and placement is how you find where budget is wasted. A Meta-focused view treats these as first-class, not an afterthought.
- Frequency as a KPI. Tracking frequency over time, next to a period-over-period CPM and CTR trend, is how you spot creative fatigue before results slide. See reach vs impressions vs frequency for how these relate.
- Adaptive lead-gen vs e-commerce KPIs. A lead-gen account wants cost per lead and lead volume; an e-commerce account wants ROAS and purchases. DashOps shows the right set automatically, rather than a one-size layout. The post on ROAS vs CPL vs CPA explains which to lead with.
On judging whether a number is good: there is no universal benchmark to chase. Compare each metric against your own margin, your goal, and your prior period. Break-even ROAS, for instance, is 1 divided by your profit margin, which is specific to your business and not something a generic dashboard average can tell you.
Lead capture and the 90-day window
If you run Meta Instant Forms, exports matter more than they first appear. Meta only lets you download Instant Form leads directly from the Page for a limited window, about 90 days, after which leads must be retrieved through the API or a connected tool. A reporting workflow that also captures and exports those leads on a regular schedule protects you from losing them.
DashOps captures Instant Form leads and exports them to CSV or Excel, so the report and the lead list stay in one place. If you sit on the lead-gen side, export Meta Instant Form leads to CSV covers the cadence.
Exports, white-label, and client delivery
For agencies, freelancers, and in-house teams who share results, delivery format is often the deciding factor.
- Native exports. DashOps produces PDF, Excel, and CSV directly. No copy-paste, no rebuilding a layout for each client.
- Scheduled digests and alerts. Email digests, plus Slack and Discord alerts, push results out automatically instead of waiting for someone to log in.
- White-label and client access. Public read-only share links and a simplified client portal, with white-label Lite on Growth and white-label Full with custom domains on Enterprise. Roles cover Admin, Team member, and read-only Client user.
If client-facing reporting is your main use case, white-label client reporting walks through the tiers in detail.
How to compare on price without guessing
Do not compare on headline price alone, and do not trust any number you cannot verify on a current pricing page. The model matters more than the figure.
- Pricing model. Cross-channel suites often price by data source or seat. DashOps prices per ad account. The cheaper option depends entirely on how many accounts and channels you run.
- What the entry tier includes. Check whether the lowest tier actually includes the exports, breakdowns, and white-label level you need, or whether those sit on a higher plan.
- View-only vs full module. With DashOps, Starter is view-only reporting; Growth and Enterprise add the full Meta module including campaign create and edit.
For more on what to weigh, the Ads Manager vs reporting dashboard comparison and the full list of Meta Ads KPIs to track are useful next reads.
DashOps is built as a Meta-only reporting dashboard, so if Facebook and Instagram are your paid channels, the depth on KPIs, breakdowns, and adaptive lead-gen vs e-commerce views is the trade you are making against cross-channel breadth. See what each plan includes on the pricing page, and the help center covers connecting an ad account and setting up exports. As a Whatagraph pricing alternative, the question is not which tool is better in the abstract, but whether you need many channels or deeper Meta reporting.
The takeaway: pick the tool whose depth matches your channels, and verify exports and white-label on a current pricing page before you commit.
Frequently asked questions
Is a Meta-only dashboard worth it if I only run Facebook and Instagram Ads?
Can a Whatagraph alternative produce white-label client reports?
How should I compare reporting tools on price without exact numbers?
See it in your own dashboard
DashOps brings Meta Ads reporting, campaign management, and white-label client portals into one place. Pick the plan that fits how you run ads.