How to Spot Wasted Facebook Ad Spend Using Breakdown Reports
Wasted ad spend rarely shows up in your headline numbers. The account total can look fine while specific slices quietly burn budget underneath it. To spot wasted Facebook ad spend, you break the account apart by demographic, placement and campaign, compare each slice against your own cost target, and move money from the losers to the winners. Breakdown reports are the tool for this, because they expose the segments an account-level summary hides. Below is a repeatable method: read the placement, age and gender, and campaign breakdowns in order, decide what counts as waste using your own goals rather than a generic benchmark, and reallocate deliberately.
Why account totals hide wasted ad spend
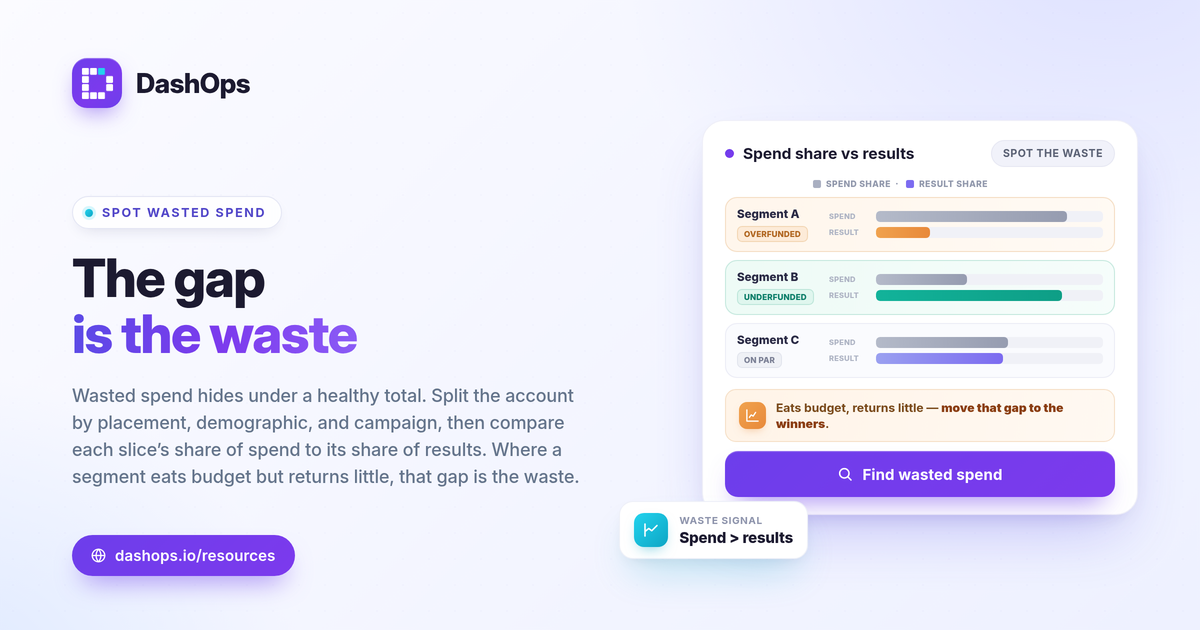
A single spend figure averages your best and worst segments into one number. If half your budget earns a strong return and the other half earns almost nothing, the blended result can still look acceptable, and the waste stays invisible. This is the core problem with reading only the top line: it tells you the money was spent, not whether each part of it worked.
A breakdown report waste check fixes this by splitting the same spend into segments you can judge one at a time. The question stops being “did the account do well” and becomes “which specific slices are dragging the average down.” That second question is the one that finds underperforming campaigns and the wasted ad spend on Meta you can actually act on.
Start with the placement breakdown
Placement is often where the cheapest waste hides, because budget can flow to slots that generate impressions without generating results.
- Compare cost per result by placement. Look at where your purchases or leads actually come from versus where the spend lands. A placement that takes a meaningful share of budget but returns few results is a flag.
- Watch spend share versus result share. If one placement consumes a large slice of spend and a small slice of results, that gap is your waste signal.
- Note frequency where it climbs. A placement showing high frequency with falling results points to fatigue rather than fresh reach, which means more spend buying the same tired impressions.
Be careful before you cut. When Meta optimizes delivery automatically, excluding a placement can disrupt how the system learns, so a gradual budget shift is often safer than a hard exclusion. For a deeper look at reading placement data, the placement performance comparison guide walks through it in detail.
Read the age and gender breakdown
The demographic breakdown answers a blunt question: who is your money reaching, and who is actually converting. These are frequently not the same group.
- Find the gap between spend and results by segment. An age or gender band that takes budget but produces little compared with the rest is a candidate to trim.
- Look at cost per result, not raw volume. A segment can drive a lot of clicks and still cost too much per purchase or per lead. Efficiency is the test, not activity.
- Check the trend, not just the snapshot. A segment that has slipped period over period is telling you something a single month hides.
A practical move is to confirm whether a weak demographic is weak everywhere or only in one campaign. The full method lives in the demographic breakdown report guide. The point is to isolate where the waste actually sits before you touch any budget.
Use the campaign breakdown to confirm
Placement and demographics tell you how spend behaves across slices. The campaign view tells you which line items are carrying the account and which are dragging it.
- Rank campaigns by cost per result. The ones consistently above your target cost are where to look first.
- Cross-check against the demographic and placement findings. If a weak campaign is also the one over-serving a weak placement or audience, you have converging evidence rather than a guess.
- Separate new campaigns still learning from mature ones that have settled. A campaign in its early phase needs more time before you judge it. A mature campaign that stays expensive is a clearer cut.
To decide which numbers matter at the campaign level, the Meta Ads KPIs to track post covers the metrics worth ranking on.
Decide what counts as waste using your own goals
There is no universal number that defines a wasteful segment. What looks expensive for one business is healthy for another, because it depends on margin and objective. Judge each segment against your own target instead of a borrowed benchmark.
- Anchor to your cost target. For sales, compare ROAS to your break-even, where break-even ROAS = 1 / profit margin. For lead gen, compare cost per lead, where cost per lead = spend / leads, to what a lead is worth to you.
- Require enough data to be meaningful. A segment with one or two conversions is noise, not a verdict. Wait for enough spend and results before cutting.
- Weight the trend. A segment drifting above your target across consecutive periods is a stronger signal than a single weak window. Period-over-period comparison is what separates a real decline from a normal fluctuation.
One caution on the numbers themselves: iOS privacy changes cause Meta to undercount some conversions, so a segment can look slightly worse in-platform than it is in reality. That does not erase the relative comparison between segments, but it is a reason to weigh trends over absolutes. If your reported and actual results diverge widely, the iOS underreporting explainer covers why.
Reallocate, then watch the next period
Finding the waste is half the job. The other half is moving budget without breaking what already works.
- Change one thing at a time. Shift budget away from one weak segment, then watch the next period before the next move. Stacked changes make it impossible to know what caused the result.
- Move money toward proven winners, not untested guesses. The segments that already beat your cost target are the safest home for reallocated budget.
- Re-run the same breakdowns next period. Waste is not a one-time find. Audiences fatigue and costs drift, so this becomes a recurring check rather than a single cleanup.
This is where a reporting view that holds every breakdown in one place earns its keep. DashOps reads your demographic, placement and campaign breakdowns across one or more Meta ad accounts with period-over-period comparison built in, so the slices that quietly waste budget surface without exporting and stitching spreadsheets. See what each plan includes on the pricing page, and the help center covers connecting an account. If you also report to clients, the same breakdowns drop into a white-label client report, and if you are weighing the dashboard against native tools, the Ads Manager versus reporting dashboard comparison lays out the difference.
Run the placement, demographic and campaign breakdowns in that order each period, judge every slice against your own cost target, and the wasted spend stops hiding.
Frequently asked questions
What breakdowns reveal wasted Facebook ad spend fastest?
How do I know a segment is truly underperforming and not just unlucky?
Should I pause a wasteful segment or just shift budget away from it?
See it in your own dashboard
DashOps brings Meta Ads reporting, campaign management, and white-label client portals into one place. Pick the plan that fits how you run ads.