How to Build a Facebook Ads Demographic Breakdown Report by Age and Gender
A Facebook Ads demographic breakdown report answers one question: which age and gender segments actually drive your results, not just which ones see your ads. Meta delivers to a mix of people automatically, so your raw spend hides the fact that one age bracket may be carrying the account while another quietly wastes budget. This guide walks through turning raw Meta delivery into an age and gender breakdown report you can act on. You will pull the right data, line it up against the metric tied to your goal, and read it so the audiences that convert get more budget and the ones that do not get cut.
Why an age and gender breakdown matters
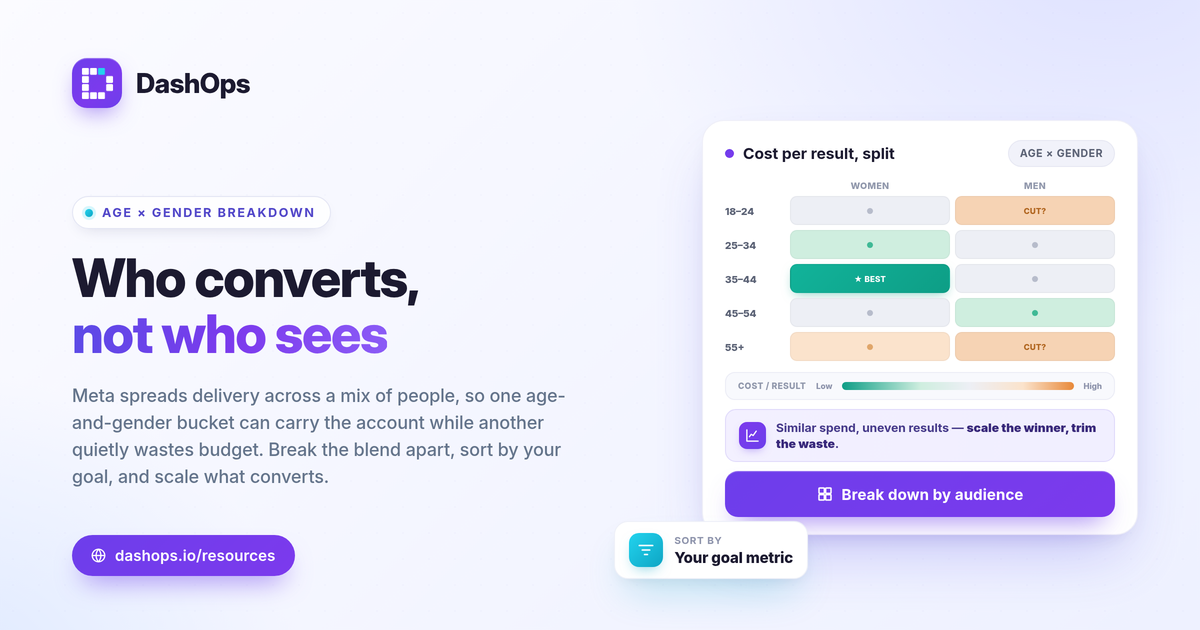
Meta’s targeting is broad by default, and its delivery system decides who actually sees each ad. That means your audience reporting often looks nothing like the audience you thought you set. Without an age and gender breakdown, you are averaging strong and weak segments into one blended number that tells you almost nothing.
A demographic performance dashboard splits that blend apart. It can show you, for example, that for Acme Apparel one age and gender bucket is bringing in purchases at a far lower cost per result than another, even though both got similar spend. The exact gap is whatever your own data says it is, and the point is that you can finally see it instead of burying it inside one account-wide average. That is the difference between a report that describes the past and one that changes what you do next.
Step 1: Pull the raw delivery data
Start in Facebook Ads Manager or your reporting tool with a clear date range. A single week is usually too noisy for demographic splits because each age and gender bucket gets only a slice of the data. Aim for a period long enough that each segment has meaningful volume.
- Set the level. Decide whether you want the breakdown at the account, campaign, ad set, or ad level. Account level shows the big picture; ad set level shows which audiences inside a campaign are pulling their weight.
- Apply the breakdown. In Ads Manager, use Breakdown, then By Delivery, then Age and Gender. Meta returns one row per age bracket and gender combination.
- Choose a consistent window. Use the same date range every time you run the report so period-over-period comparison stays honest.
Step 2: Pick the metric that matches your goal
Age and gender rows are useless until you attach them to the result you care about. The right metric depends on whether you sell or capture leads.
- Lead generation. Lead with leads and cost per lead. Cost per lead is spend divided by leads, calculated per segment.
- E-commerce. Lead with purchases and ROAS. ROAS is conversion value divided by spend, again per segment.
- Either way, keep a supporting set. CTR (clicks divided by impressions) and CPC (spend divided by clicks) help you diagnose why a segment is cheap or expensive before the conversion data even lands.
DashOps adapts the metrics it leads with to your campaign goal, so a lead-gen account surfaces leads and cost per lead while an e-commerce account surfaces purchases and ROAS, instead of forcing you to read every column. If you want a refresher on which numbers belong together, the 17 Meta Ads KPIs every advertiser should track lays them out.
Step 3: Read the breakdown as a story
A table of numbers is not a report. The skill is reading the rows against each other, not in isolation.
- Sort by your goal metric. Put cost per lead or ROAS in front and order the segments from best to worst. The top and bottom rows are where the decisions live.
- Check the volume behind each row. A segment with two leads at a great cost per lead is noise, not a signal. Discount rows with thin data.
- Look at the efficiency clues. A segment with a strong CTR but a weak conversion rate points at a landing-page or offer mismatch for that group, not an audience problem.
- Compare to the prior period. A number is just a number until you know whether it moved. A segment that was your best last month and slipped this month deserves a closer look before you cut it.
This is where “what is a good split” gets answered honestly. There is no universal benchmark for which age or gender performs best. A segment is good when it beats your own target cost per result and beats your other segments for the same period, judged against your margin and your goal.
Step 4: Decide what to do with what you found
A report that ends in a table is half a report. The point is the action.
- Scale the winners. If one age and gender bucket consistently beats your target, give it more room, whether through a dedicated ad set or by leaning your creative toward it.
- Investigate the middle. Segments near your target are usually a creative or offer question, not a kill decision.
- Trim the losers carefully. A segment far above your target cost, with enough volume to trust, is a candidate to exclude. Confirm the trend holds across more than one period first.
Keep one caveat in mind throughout. iOS and the App Tracking Transparency prompt cause conversion undercounting, so the purchase and lead columns in your breakdown are a floor, not a precise count. Treat the demographic split as a strong directional signal and reconcile the totals against your own sales or CRM data before making a large budget move.
Step 5: Make it repeatable
A one-off breakdown is a snapshot. The value compounds when you run the same Meta Ads breakdown by audience on a schedule and watch the segments shift.
- Fix the format. Same date window, same level, same goal metric every time.
- Track the trend. Period-over-period comparison turns a static split into a moving picture of which audiences are gaining or fading.
- Pair it with placement. Age and gender tells you who; a placement performance comparison tells you where. Read together, they explain most of the variance in an account.
Pulling this by hand in Ads Manager every week, setting the breakdown, copying columns into a spreadsheet, is slow and easy to get wrong. DashOps reads the age and gender breakdown for every connected Meta ad account in one dashboard, with period-over-period comparison and adaptive lead-gen or e-commerce metrics built in, so the segment that is winning or wasting budget is visible at a glance. See what each plan includes on the pricing page, and the help center covers connecting an account and reading the breakdowns.
The takeaway: an age and gender report is only worth running if it ends in a budget decision, so always sort by your goal metric and act on the best and worst rows.
Frequently asked questions
Where do I find the age and gender breakdown in Facebook Ads Manager?
Why does my demographic breakdown not show purchases or leads?
What age and gender split counts as good for Facebook Ads?
See it in your own dashboard
DashOps brings Meta Ads reporting, campaign management, and white-label client portals into one place. Pick the plan that fits how you run ads.