iOS Facebook Ads Underreporting: How Much You're Losing and How to Measure True Performance
Most accounts are not actually performing as poorly as Meta sometimes shows after an iOS update, because iOS Facebook Ads underreporting hides conversions that genuinely happened. When a user declines app tracking, Meta loses the signal that ties a sale or lead back to your ad, so the conversion goes uncounted or gets estimated. There is no single universal percentage for how much is lost, so a benchmark you read somewhere is a starting point, not your number. The reliable way to measure true performance is to read Meta modeled conversions and trend data together, then reconcile both against your own sales or CRM totals. This guide walks through how to do that without guesswork.
Why iOS underreporting happens
The shift came with Apple App Tracking Transparency framework, often shortened to iOS 14 ad tracking changes. ATT requires apps, including Facebook and Instagram, to ask permission before tracking a user across other apps and websites. A large share of users decline.
When someone opts out, Meta can no longer reliably observe what that person did after clicking your ad. That breaks the link between the click and the conversion. The result is ATT conversion loss: real purchases and leads that Meta cannot attribute, so they either go missing from your reports or get filled in by estimation.
Two things are worth separating here:
- The event still happens. The sale lands in your store. The lead lands in your CRM. iOS does not stop the conversion, it stops Meta from seeing it.
- The reporting undercounts. Meta underreporting on iOS means the dashboard shows fewer conversions and a worse ROAS than reality, not that the campaign failed.
This is why your Meta numbers and your actual sales drift apart. We cover that gap in more depth in why are Facebook ad conversions lower than sales.
How much are you actually losing
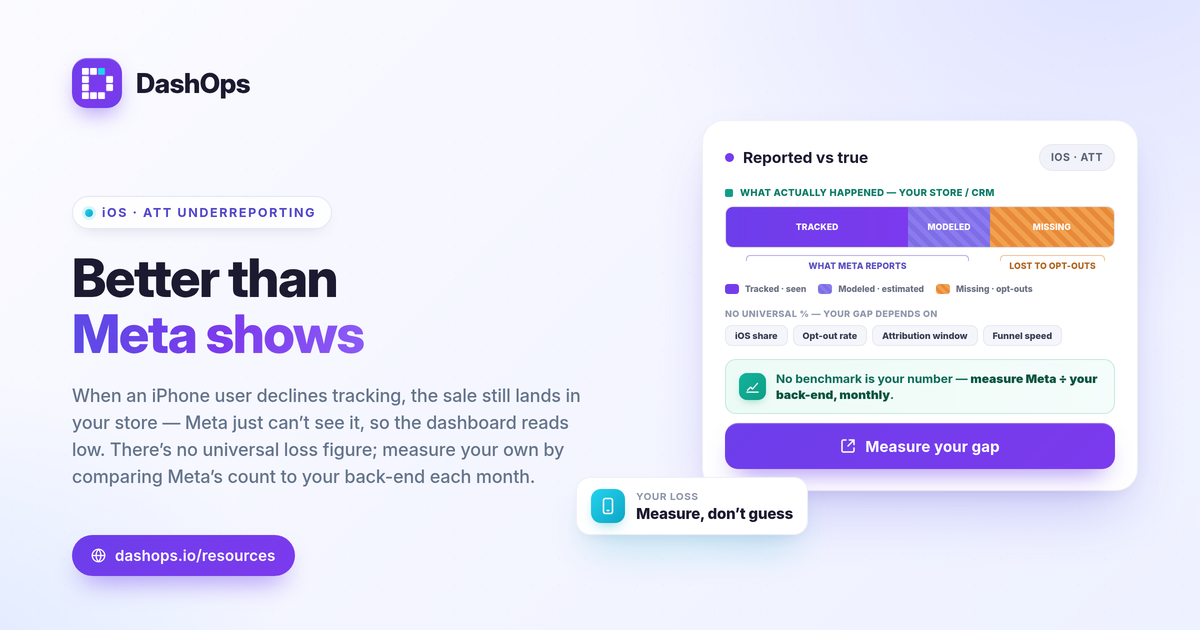
The honest answer is that no universal percentage applies to your account. Benchmarks get repeated online, but the only figure that means anything for your spend is the one you measure yourself, because your real loss depends on a few specifics.
- Your iOS share. The more of your audience uses iPhones, the larger the exposure to ATT.
- Your opt-out rate. Within iOS, only the users who decline tracking create blind spots.
- Your conversion window. Longer windows give more time for a conversion to land outside the tracked period.
- Your funnel speed. Same-session purchases get captured more often than conversions that happen days later.
To find your own figure, do not trust a benchmark. Take a fixed date range, pull Meta reported conversions, and compare them to the same conversions counted in your store or CRM. The difference is your underreporting gap. Run that comparison every month and you will see the gap settle into a stable pattern you can plan around.
What modeled conversions mean in your reports
To partly close the blind spot, Meta uses modeled conversions reporting. When it cannot observe an event directly because of an opt-out, it estimates how many conversions likely occurred based on the users it can still see. These modeled conversions get blended into the totals you read.
A few points keep this from misleading you:
- Modeled is not fabricated. It is a statistical estimate built from observable behavior, designed to approximate the conversions ATT hid.
- Modeled is still an estimate. Treat these totals as directional. They are your best in-platform read, not a ledger.
- The mix shifts over time. As Meta models adjust, the modeled share of your totals can move, which is one reason a single day in isolation can mislead.
Because modeled numbers are estimates, the trend matters more than any one figure. That is the core habit this guide is building toward.
Read the trend, not the daily number
A single day conversion count is the least reliable thing in your report, especially with modeling in the mix. Period-over-period comparison is far more trustworthy, because the same estimation logic applies on both sides of the comparison, so the direction of change stays meaningful even when the absolute number is soft.
Watch these signals over weeks rather than days:
- Conversion and cost per result trend. Is cost per lead or cost per purchase rising or falling versus the prior period? Cost per lead is simply spend divided by leads, so it moves with both budget and result volume.
- Spend pacing against results. If spend climbs while modeled conversions flatten, that is a real signal regardless of the absolute count.
- Frequency and fatigue. Rising frequency with softening results often explains a dip better than attribution does. Our note on Facebook ad frequency fatigue analysis covers how to read that.
Trend reading is where a dashboard earns its place. DashOps reports Meta-native numbers with period-over-period comparison built in, so you are comparing like with like instead of reacting to one noisy day.
How Pixel and the Conversions API fit in
Server-side tracking is the main lever you control. The browser Pixel fires from the user device, where browser limits and opt-outs can drop events. The Conversions API, or CAPI, sends the same events from your server, recovering signal the Pixel alone can miss.
Running both together generally improves what Meta can attribute. A few rules keep it clean:
- Run CAPI alongside the Pixel, not instead of it. They complement each other.
- Deduplicate events. Send a shared event identifier so a single conversion sent by both methods is counted once, not twice.
- Understand the limit. CAPI recovers signal, but it does not override a user ATT choice. It reduces undercounting, it does not erase it.
We explain the mechanics in Pixel vs Conversions API reporting. One thing to be clear about: a reporting dashboard reads the numbers Meta reports. DashOps does not perform blended or server-side attribution itself, and no dashboard reverses an opt-out. What a dashboard does is help you read Meta reported numbers consistently across every report.
Confirm against your own sales
The final check sits outside Meta entirely. Whatever the platform shows, your store and CRM hold the ground truth.
- Reconcile monthly. Match Meta conversions to back-end sales or qualified leads for the same dates.
- Decide which number leads. For spend decisions inside Meta, the platform own figures keep the optimization consistent. For reporting true return to yourself or a client, anchor to back-end totals.
- Check your attribution window. A shorter window reports fewer conversions than a longer one for the same campaign, so lock one setting and keep it consistent across reports. Our guide on Meta Ads KPIs to track covers which metrics to standardize, and Facebook Ads Manager vs a reporting dashboard explains why pulled reports can differ from the live Ads Manager view.
If you manage reporting across accounts or for clients, doing this reconciliation by hand each month gets heavy fast. DashOps pulls every Meta KPI into one dashboard with period-over-period comparison, scheduled digests, and white-label client reports, so the trend reading and consistency this requires happen in one place. See what each plan includes on the pricing page, and the help center walks through connecting an ad account.
The practical takeaway: stop judging iOS performance by any single day count, read the trend in modeled conversions, and reconcile against your own sales to know what your ads truly delivered.
Frequently asked questions
How much do iOS Facebook Ads underreport conversions?
What are modeled conversions in Meta reporting?
Does the Conversions API fix iOS underreporting?
See it in your own dashboard
DashOps brings Meta Ads reporting, campaign management, and white-label client portals into one place. Pick the plan that fits how you run ads.