Facebook Ads Placement Performance Comparison: Feed vs Reels vs Stories
Where Feed, Reels, and Stories actually differ
A Facebook Ads placement performance comparison answers a budget question: are Feed, Reels, and Stories each pulling their weight, or is one quietly draining spend while another carries the results. Advantage+ placements (Meta’s automatic distribution) spread your budget across all of them by default, which is efficient to set up but hides where the money actually converts. The fix is a Meta Ads placement breakdown that puts each surface side by side on the same metrics: cost, click behavior, and conversions. Once you see Feed versus Reels versus Stories on equal terms, you can decide where to shift budget instead of trusting the default split. This post walks through what to compare, how to read it, and what to do with the answer.
Why Advantage+ defaults hide the answer
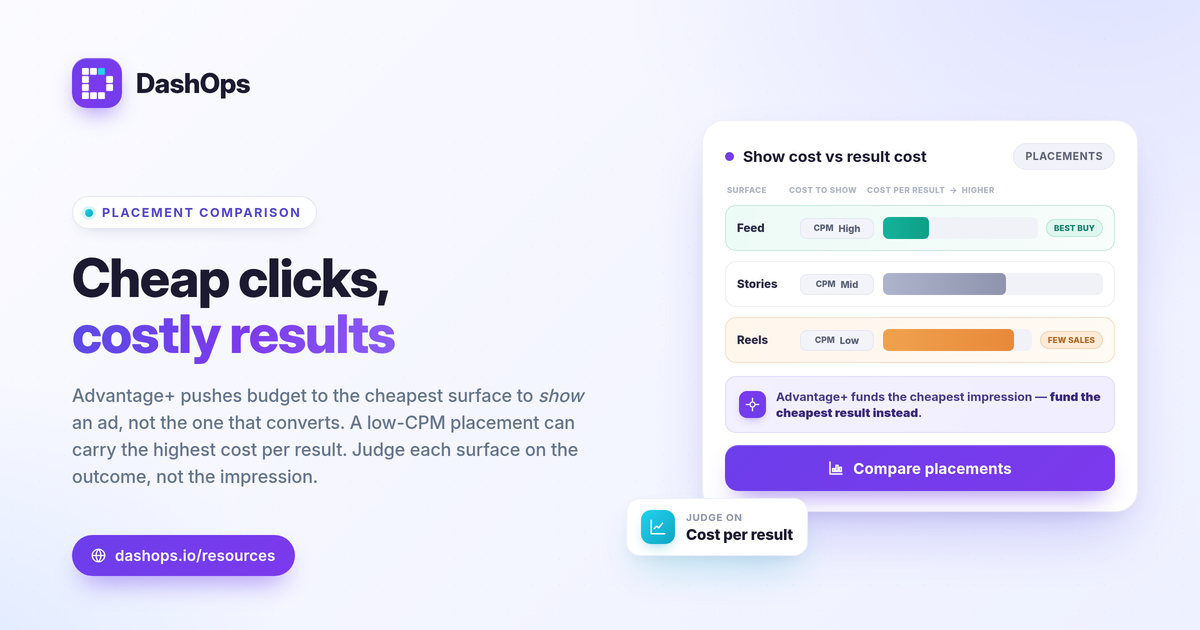
Advantage+ placements optimize for whatever is cheapest to deliver in the moment, not for your downstream goal. That often means a large share of spend lands in the placements with the lowest CPM, which are not always the placements that drive purchases or leads. The campaign total can look fine while one surface props up the average and another underperforms underneath it.
That is the whole case for a placement breakdown. The aggregate hides the spread. You are not trying to prove Advantage+ wrong, you are trying to see inside it so you can intervene when one placement clearly earns more.
The metrics to compare across placements
Pull the same columns for Feed, Reels, and Stories so the comparison is apples to apples. Lead with cost and outcomes, not vanity reach.
- Spend. How much each placement consumed. This frames everything else.
- CPM. Spend / impressions times 1000. Tells you what it costs to be seen on each surface.
- CTR. Clicks / impressions. Whether the placement earns attention that turns into a click.
- CPC. Spend / clicks. The price of a click on each surface.
- Cost per result. Cost per purchase (spend / purchases) or cost per lead (spend / leads), depending on your goal.
- ROAS, for e-commerce. Conversion value / spend, read per placement.
Reels and Stories are full-screen vertical surfaces, so CPM and CTR there behave differently than in-Feed. A low CPM placement with a weak cost per result is not a bargain, and a pricier placement that converts can be the better buy. Judge each surface on the cost of the outcome, not the cost of the impression. If you want a refresher on which numbers matter and how they relate, see the Meta Ads KPIs to track.
How to read a placement comparison
Numbers alone do not decide anything. Read them in order against your own goal.
- Start at cost per result. The placement with the lowest cost per purchase or per lead is your efficiency leader. That is the headline, not impressions.
- Check spend share against result share. If Feed takes a large share of spend but a small share of results, budget is misallocated, regardless of how its CPM looks.
- Use CTR and CPC to explain the gap. A weak cost per result usually traces back to either a high CPM (expensive to show) or a low CTR (the creative does not land on that surface). Knowing which one points you at the fix.
- Mind the volume. A placement can show a great cost per result on a handful of conversions. Give it enough data before you act, and weigh thin numbers cautiously.
Judge “best” against your goal, not a universal number
There is no fixed cost per lead or ROAS that makes a placement good across every account. The best Facebook ad placements for one advertiser are the ones that hit that advertiser’s target cost and margin, and those numbers vary by offer, audience, and industry.
So set the bar yourself. Compare each placement against three things: your target cost per result, your break-even ROAS (1 / profit margin), and the same placement’s number in the prior period. A placement that beat your target last month and held this month is working. One that drifted past your acceptable cost is the one to question. Period-over-period comparison is what separates a real trend from one noisy week.
Don’t read placement data in isolation
A placement breakdown is most useful next to your other breakdowns, because the same weakness can show up in more than one cut. A demographic breakdown by age and gender can reveal that a placement underperforms only for one segment, not across the board. Frequency matters too: as frequency climbs on a given surface, results often soften, which is fatigue rather than a bad placement. For that read, pair this comparison with a demographic breakdown report and watch frequency as a KPI over time.
One more caution on attribution. iOS privacy changes and the App Tracking Transparency prompt cause Meta to undercount some conversions, which can make placements that skew toward iOS users look worse than they are. Read placement numbers knowing the conversion column is conservative, not absolute.
What to do once you see the split
The point of the comparison is a decision. A few practical moves:
- Shift budget toward the efficiency leader. If one placement consistently beats your target cost per result, give it more room, either by raising its share or by testing it as a dedicated placement.
- Fix the creative before cutting a placement. A weak CTR on Reels or Stories is often a sign the asset was built for Feed. Vertical, native-feeling creative can change the result before you write the surface off.
- Re-check after every meaningful change. Placement performance moves with creative, audience, and season, so treat the comparison as a recurring review, not a one-time call.
Bringing the comparison into one view
Building this in Ads Manager means toggling the placement breakdown, adding the right columns, and re-creating the comparison each time, which is slow and easy to misread. DashOps puts the Meta Ads placement breakdown in a placement reporting dashboard with the cost and conversion KPIs side by side and period-over-period comparison built in, across all your ad accounts. You can also schedule it as an automated report or share a read-only link with a client. See what each plan includes on the pricing page, and the help center covers setup. For more on why a dashboard beats the native view, see Ads Manager versus a reporting dashboard.
The takeaway: compare Feed, Reels, and Stories on cost per result against your own target and prior period, then move budget toward what earns it.
Frequently asked questions
How do I compare placement performance in Facebook Ads?
Should I turn off Advantage+ placements to control where ads run?
Why do Reels and Stories show different CPM and CTR than Feed?
See it in your own dashboard
DashOps brings Meta Ads reporting, campaign management, and white-label client portals into one place. Pick the plan that fits how you run ads.