What Is ROAS in Meta Ads and How Do You Calculate It?
What ROAS means in Meta Ads
ROAS stands for return on ad spend, and it answers one question about your Meta Ads: for every unit of currency you put in, how much revenue came back out. That is what is ROAS in Meta Ads at its core, and the return on ad spend formula is simple: ROAS = conversion value divided by ad spend. If you spent 1,000 and your campaigns drove 4,000 in tracked purchase value, your ROAS is 4, often written as 4x or 4:1. It is the headline efficiency metric for e-commerce because it ties spend directly to sales value, not just clicks or leads.
The return on ad spend formula, step by step
Here is how to calculate ROAS without ambiguity.
- ROAS = conversion value / spend. Conversion value is the total revenue Meta attributes to your ads, usually purchase value reported by the Meta Pixel or Conversions API.
- Spend is the amount Meta charged for the ads in the same window.
- Express it as a multiple. A ROAS of 3 means every 1 spent returned 3 in tracked sales value.
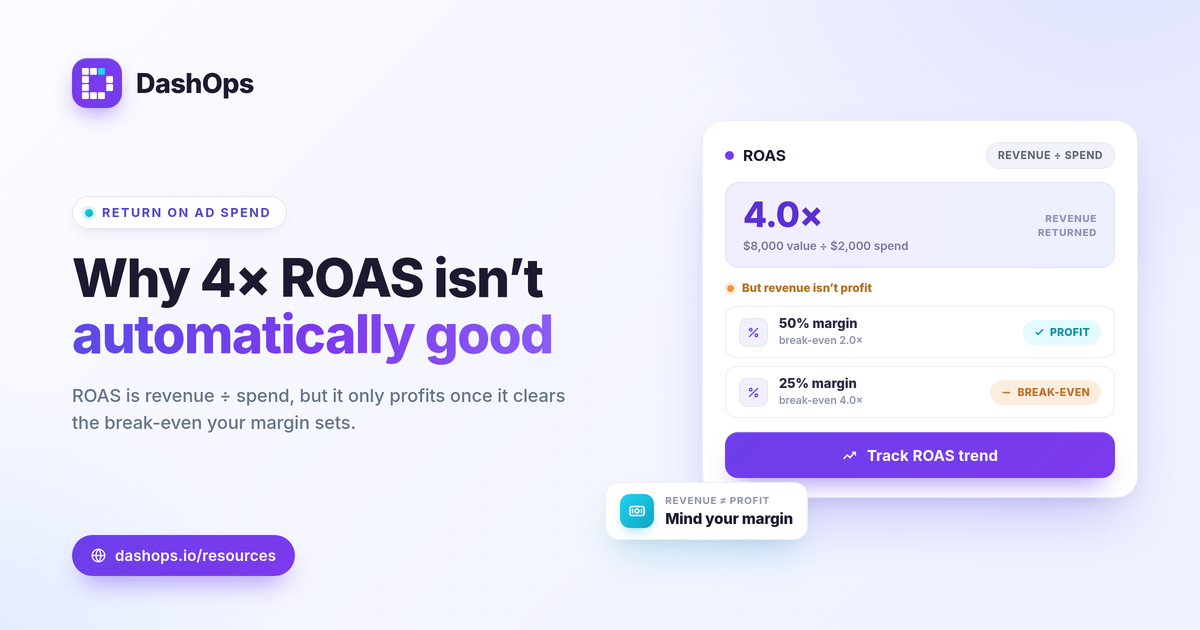
A quick worked example with demo data: Acme Apparel spends 2,000 on a campaign and Meta reports 8,000 in purchase value. ROAS = 8,000 / 2,000 = 4. That single number tells you the campaign returned four times its cost in revenue, before you account for the cost of goods, shipping, or fees.
ROAS vs profit margin: why 4x is not automatically good
ROAS measures revenue returned, not profit kept. This is the most important distinction to understand, and it is where ROAS vs profit margin comes in. A 4x ROAS sounds strong, but if your product carries thin margins, that same 4x can still lose money after costs. A higher-margin product can be profitable at a much lower ROAS.
The tool for judging this is break-even ROAS, which you calculate from your margin: break-even ROAS = 1 / profit margin. If your profit margin is 50 percent, your break-even ROAS is 2, so anything above 2x is profitable. If your margin is 25 percent, break-even is 4, and a 4x ROAS only breaks even. Always read ROAS against your own break-even point, not in isolation.
What is a good ROAS in Facebook ads?
There is no universal number that defines a good ROAS in Facebook ads, and any source quoting a single magic figure is oversimplifying. What counts as good depends on three things you control:
- Your margin. Calculate break-even ROAS first. A good ROAS is comfortably above your break-even, with enough cushion to cover overhead and still profit.
- Your goal. A prospecting campaign reaching cold audiences will usually show a lower ROAS than a retargeting campaign hitting warm shoppers. Judge each against its job, not against each other.
- Your trend. The most useful benchmark is your own past performance. Is ROAS this period higher or lower than last period at the same spend level? A period-over-period comparison turns a flat number into a signal.
If you want category context for setting expectations, the good ROAS for ecommerce Facebook ads and break-even ROAS guides go deeper. For setting expectations across metrics, the Meta ads KPIs to track overview covers where ROAS fits alongside CPC, CPM, and CTR.
Why your reported ROAS may understate the truth
The ROAS Meta shows you is built on attributed conversions, and attribution has known gaps. Since the iOS App Tracking Transparency changes, Meta cannot observe every conversion from users who opted out of tracking, which tends to cause undercounting. Some real sales never get attributed to the ad that drove them, so your reported ROAS can read lower than your blended, real-world return.
This matters when you compare Meta’s numbers to your store’s actual revenue. They will rarely match exactly. DashOps reports the Meta-native ROAS straight from the API so your dashboard agrees with Ads Manager, rather than inventing a separate blended figure. To understand the discrepancy itself, see why Facebook ad conversions are lower than sales.
How ROAS shows up in DashOps
ROAS is one of the adaptive KPIs in the DashOps dashboard. For e-commerce ad accounts, it appears as a headline tile alongside spend, purchases, and cost per purchase, with a period-over-period comparison and a trend chart so you see direction, not just a snapshot. For lead-gen accounts, the dashboard adapts to surface cost per lead instead, since ROAS is less meaningful when there is no purchase value to divide by.
A few practical ways to read it inside a report:
- Pair ROAS with spend. A rising ROAS on falling spend can mean you scaled back into your best audiences. A rising ROAS on flat spend is cleaner efficiency.
- Watch the trend line. A single period hides the story. The trend chart shows whether efficiency is improving or sliding.
- Segment with breakdowns. Demographic and placement breakdowns show which audiences and placements carry the return, so you can spot wasted spend.
If you manage more than one store or client, pulling ROAS for every ad account into one place removes a lot of manual export work. DashOps reads ROAS and 17 plus Meta KPIs across all your connected ad accounts in a single dashboard, with white-label client reports for sharing the result. See what each plan includes on the pricing page, and the help center walks through connecting an account. If you currently pull these numbers by hand, the Ads Manager vs a reporting dashboard comparison is a useful next read.
The takeaway
ROAS is conversion value divided by spend, but it only means something once you compare it to your break-even ROAS and your own prior-period trend.
Frequently asked questions
What is the formula for ROAS in Meta ads?
What is a good ROAS for Facebook ads?
Why is my Meta ROAS lower than my actual sales?
See it in your own dashboard
DashOps brings Meta Ads reporting, campaign management, and white-label client portals into one place. Pick the plan that fits how you run ads.