What Is Cost Per Result in Facebook Ads and How Is It Different From CPA?
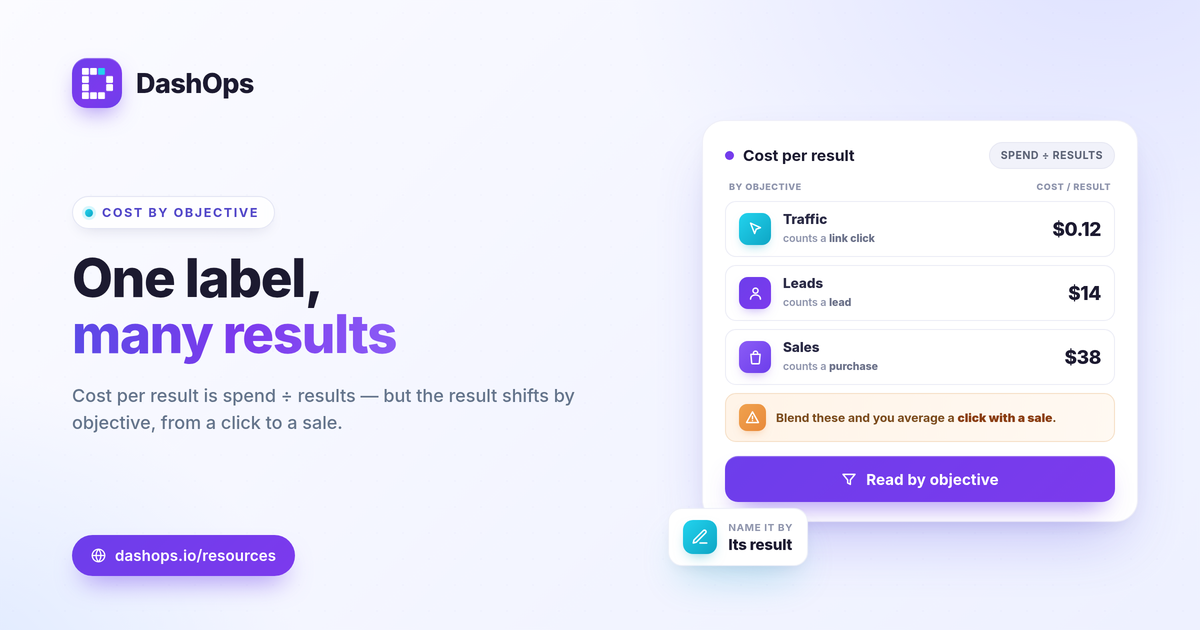
Cost per result in Facebook ads is the average amount you paid for each result your campaign was optimized to produce, calculated as spend divided by the number of results. The catch is that “result” is not a fixed action. It changes with your campaign objective, so a result can be a link click, a landing page view, a lead, or a purchase. That makes cost per result the most objective-dependent metric Meta reports, and it is why two campaigns can show wildly different numbers while both look fine. This guide defines the metric, contrasts cost per result vs CPA, and shows how a reporting dashboard normalizes Meta ads cost per result across objectives so the number actually means something.
What cost per result actually measures
Cost per result is a simple division: total spend divided by total results. The formula never changes. What changes is the numerator’s counterpart, the result itself.
- Traffic objective. A result is usually a link click or a landing page view.
- Engagement objective. A result might be a post engagement or a page like.
- Leads objective. A result is a lead, often an Instant Form submission.
- Sales objective. A result is a purchase or another conversion event.
So the line item labeled “cost per result” in Ads Manager is really cost per whatever-this-campaign-optimizes-for. The result rate Facebook ads reporting shows alongside it follows the same logic: it is the percentage of impressions or clicks that turned into that result. Both numbers are meaningless until you know which action they count.
Cost per result vs CPA: where they overlap and split
CPA stands for cost per acquisition, and it usually points at a meaningful conversion: a purchase, a signup, or a qualified lead. Cost per result points at whatever the objective is set to optimize. The relationship depends entirely on that objective.
- They match when your objective is the conversion itself. A sales campaign optimized for purchases shows a cost per result that is your cost per purchase, which is your CPA.
- They diverge when your objective is an upper-funnel action. A traffic campaign reports a cheap cost per result because link clicks are cheap, but your true CPA, the cost to actually acquire a customer, is much higher and lives further down the funnel.
The practical risk is reading a low cost per result on a traffic or engagement campaign and assuming acquisition is cheap. It is not. You are comparing the cost of a click to the cost of a sale. For a fuller breakdown of how these acquisition metrics relate, see ROAS vs CPL vs CPA explained and CPA vs CPL in Meta ads.
Why the metric breaks when you compare campaigns
The trouble starts the moment you put several campaigns side by side. If one is optimized for leads, one for purchases, and one for traffic, their cost per result columns sit in the same table but measure three different things. Summing or averaging them produces a number that means nothing.
This is the core problem with cost per result reporting. Ads Manager will happily show you a blended figure across mixed objectives, and that blend hides more than it reveals. A high cost per result on a sales campaign can be perfectly healthy, while the same number on a traffic campaign would be alarming.
To read the metric honestly you have to do one of two things:
- Segment by objective so every campaign you compare optimizes for the same result.
- Translate cost per result into its underlying action (cost per lead, cost per purchase) so the label tells you what you are paying for.
How a dashboard normalizes cost per result across objectives
This is where a reporting layer earns its place. Instead of one ambiguous column, a dashboard maps each result back to the action it represents and groups it accordingly. DashOps does this by adapting its KPIs to the campaign type: a lead-gen account surfaces cost per lead and lead volume, while an e-commerce account surfaces cost per purchase and ROAS. The metric is named for what it counts, so you never mistake a click for a conversion.
A few things this makes possible:
- Like-for-like grouping. Lead campaigns are read against cost per lead, sales campaigns against cost per purchase, so the comparison is fair.
- Period-over-period context. Every figure sits next to the prior period, which is the only reliable way to judge whether your cost per result is trending up or down.
- Top campaigns in context. The top campaigns view shows spend and results together, so an expensive result tied to a high-value purchase reads differently from an expensive click.
If you want the full list of metrics worth watching alongside it, the Meta ads KPIs to track post covers the set, and Facebook Ads Manager vs a reporting dashboard explains why the native view and a dashboard often tell the story differently.
How to judge whether your cost per result is good
There is no universal benchmark, and any post that hands you one is guessing. A useful cost per result is one your own economics can support. Judge it three ways:
- Against value. What is one result worth to you? A lead worth a large contract justifies a higher cost per lead than a low-ticket impulse purchase.
- Against margin. For sales, your cost per purchase has to clear your break-even ROAS, which equals 1 divided by your profit margin. If the result costs more than the margin it earns, it is losing money regardless of how the number looks.
- Against your own trend. Compare this period to the last. A rising cost per result with flat results often signals fatigue or rising competition, which your demographic, placement, and frequency breakdowns can help explain.
That last point matters most. The honest question is not “is this number good in the abstract” but “is it better or worse than last period for the same objective.”
Keeping the metric trustworthy in reports
Because cost per result shifts meaning by objective, it is the easiest metric to misrepresent in a client report, usually by accident. The fix is to label it precisely and group it correctly. A reporting tool that adapts to lead-gen versus e-commerce keeps the comparison clean, and white-label client reports stay credible when every result is named for the action behind it. DashOps reads cost per result across all your Meta ad accounts in one dashboard, mapped to the right action per objective, with period-over-period comparison built in. See what each plan includes on the pricing page, and the help center walks through setup. For client-facing work, white-label client reporting covers how to present these numbers cleanly.
The takeaway: cost per result is only as meaningful as the result it counts, so always read it next to its objective and your own prior period before deciding whether it is working.
Frequently asked questions
Is cost per result the same as CPA?
Why does cost per result change when I switch campaign objectives?
What is a good cost per result on Facebook ads?
See it in your own dashboard
DashOps brings Meta Ads reporting, campaign management, and white-label client portals into one place. Pick the plan that fits how you run ads.