Top Campaigns Report for Meta Ads: How to Find Your Best and Worst Performers Fast
A Meta Ads top campaigns report ranks every active campaign by spend and by an efficiency metric tied to your goal, so you can see your best performing Facebook campaigns and your worst in one glance. The fast method is simple: sort by spend to find where the money is going, then sort by ROAS (or cost per lead for lead gen) to see whether that money is working. Where high spend meets weak efficiency, you have a candidate to cut. Where strong efficiency meets room to grow, you have a candidate to scale. You do not need a spreadsheet to do this, and you do not need to read every number Meta returns.
Why rank by spend and ROAS together
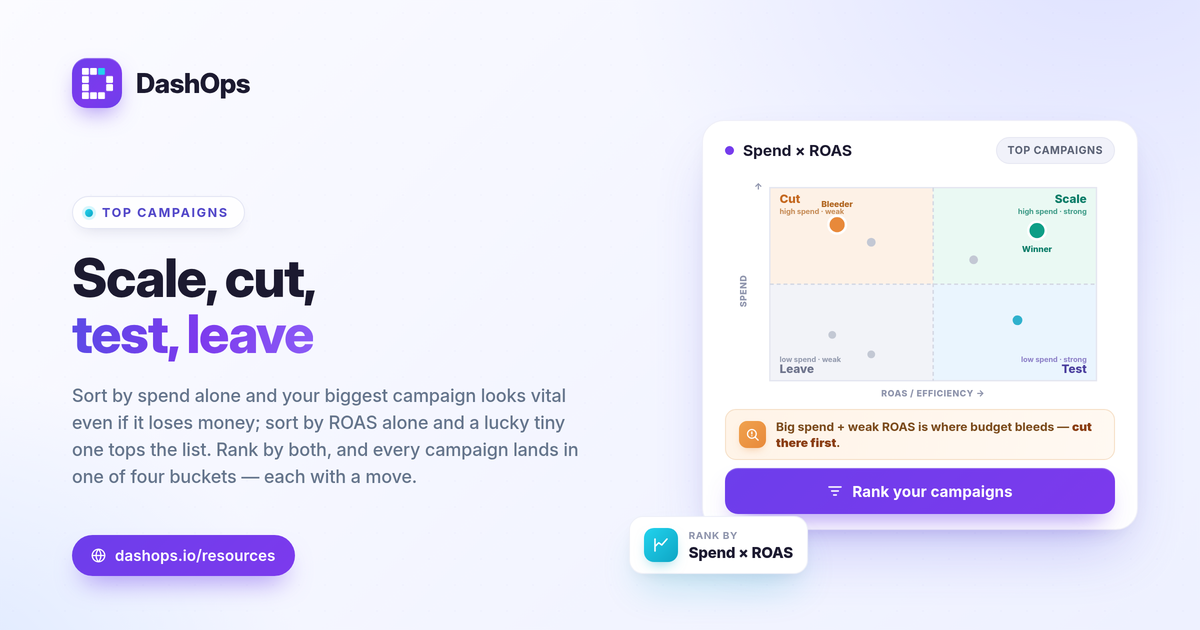
A single column lies. Sort only by spend and your biggest campaign looks important even if it loses money. Sort only by ROAS and a tiny campaign with two lucky purchases jumps to the top of your campaign performance ranking, even though it spent almost nothing. The signal lives in the combination.
- Spend tells you where the risk is. The campaigns eating most of your budget are the ones worth your attention first, good or bad.
- ROAS (or cost per result) tells you if that risk is paying off. ROAS = conversion value / spend. Cost per lead = spend / leads. Pick the one that matches your objective.
- Together they sort campaigns into four buckets. High spend and strong efficiency, high spend and weak efficiency, low spend and strong efficiency, low spend and weak efficiency. Each bucket calls for a different action.
If you are unsure which efficiency metric fits your account, ROAS vs CPL vs CPA explained walks through choosing the right one.
The four-bucket method
Once your campaigns are ranked, every one falls into a bucket that tells you what to do next.
- High spend, strong efficiency. Your winners. These are the campaigns to protect and consider scaling. Raise budgets gradually and watch whether efficiency holds as spend climbs.
- High spend, weak efficiency. Your bleeders. This is where wasted budget hides. These campaigns deserve the hardest look: pause, restructure, or cut.
- Low spend, strong efficiency. Your hidden winners. A campaign performing well on a small budget may scale, or may have too little data to trust yet. Test a budget increase and watch closely.
- Low spend, weak efficiency. Usually safe to leave or quietly turn off. They are not costing much, but they are not contributing either.
This method works because it forces a decision on every campaign instead of letting underperformers coast on a budget nobody is watching.
Judge each campaign against your own goal
There is no universal ROAS or cost per lead that means good. A 2x ROAS can be healthy for a high-margin product and a loss for a thin-margin one. The honest way to judge a campaign is against three things you control.
- Your target. Work backward from your margin. Break-even ROAS = 1 / profit margin. A campaign above that line earns money, below it loses money.
- Your prior period. Is this campaign improving or sliding? A campaign at 2.5x ROAS that was 3.5x last period is heading the wrong way, even if 2.5x sounds fine in isolation.
- Enough data to be fair. A campaign with very little spend or only a handful of results has not earned a verdict yet. Give it time before you cut it.
This is why the trend matters as much as the snapshot. A top campaigns report that only shows this period tells you who is winning today, not who is winning the race.
Check spend pacing before you scale
Before you pour budget into a winner, confirm it can actually spend more without losing efficiency. A campaign that is already pacing near its ceiling may not absorb extra budget cleanly, and a sudden increase can reset learning and push your cost per result up temporarily.
- Compare amount spent against budget. A campaign under-pacing has headroom. One pacing hot may need a structural change, not just more money.
- Watch frequency on your winners. If the same people are seeing the ad repeatedly, scaling spend can raise frequency further and erode results over time. Frequency is a real KPI you can track, and rising frequency on a top campaign is an early fatigue signal.
For the deeper version of that fatigue check, see Facebook ad frequency fatigue analysis.
A repeatable weekly routine
The point of a top campaigns report is that you can run it on a rhythm without rebuilding it each time.
- Sort by spend. See where the budget actually went this period.
- Sort by ROAS or cost per result. See which of that spend earned its keep.
- Drop each campaign into one of the four buckets. Scale, cut, test, or leave.
- Compare to last period. Confirm winners are still winning and catch sliders early.
- Act on the top three only. You do not have to touch everything. The biggest gains come from the campaigns moving the most money.
Doing this weekly catches budget drifting toward weak campaigns before it compounds. A monthly version gives slower campaigns the data they need to be judged fairly. Many accounts run both. If you want a primer on the metrics that feed this view, Meta Ads KPIs to track covers the full set.
Skip the spreadsheet export
The slow way to do all of this is to export Meta’s data, paste it into a spreadsheet, build sort columns, and rebuild it every week. The export is also frozen in time the moment you pull it, so it goes stale immediately. A reporting dashboard keeps the ranking live and sorted for you, which is the core difference covered in Facebook Ads Manager vs a reporting dashboard.
DashOps surfaces top campaigns and spend pacing as a built-in view, ranked across every connected ad account with period-over-period comparison so the trend sits right next to the snapshot. It reads Meta-native numbers, so what you scale or cut is judged on the same figures Meta reports. You can see which plans include this on the pricing page, and the help center covers connecting your accounts. For agencies and freelancers, the same ranking can go out as a white-label client report, which white-label client reporting explains in full.
The fastest way to improve a Meta Ads account is not finding a new tactic, it is putting budget behind the campaigns already winning and pulling it from the ones quietly losing, every single week.
Frequently asked questions
What should a top campaigns report show?
How do I decide which campaigns to cut?
How often should I review my top campaigns?
See it in your own dashboard
DashOps brings Meta Ads reporting, campaign management, and white-label client portals into one place. Pick the plan that fits how you run ads.