How to Read Ad Frequency to Catch Facebook Ad Fatigue Before It Hurts ROAS
Facebook ad frequency fatigue shows up as a pattern, not a single bad number: frequency climbs, click-through rate slips, and your cost per result drifts up over the same weeks. To catch it before it drags down ROAS, you read frequency alongside CTR, CPM, and cost per result on a period-over-period trend, not in isolation. The goal of this guide is simple: learn which combination of moving metrics signals creative burnout, and use trend charts to pinpoint the exact week performance started to slide so you can refresh before the spend is wasted. None of this requires a magic threshold number. It requires watching a few metrics move together against your own prior results.
What frequency actually measures
Frequency is the average number of times each person in your audience saw your ads over a date range. It is calculated from two metrics you already track.
- The formula. Frequency = impressions / reach. Impressions count every time an ad was shown. Reach counts the unique people who saw it.
- Why it rises. As a campaign runs against a fixed audience, reach grows slowly while impressions keep accumulating, so frequency creeps upward over time.
- Why it matters for fatigue. The same people seeing the same creative again and again is the mechanism behind ad fatigue. Frequency is the number that exposes it.
For a deeper split of these three related metrics, see reach vs impressions vs frequency.
Why a single frequency number tells you nothing
The most common mistake in ad fatigue analysis is asking “what frequency is too high” and looking for one answer. There isn’t one, because what is fine for one campaign is a problem for another.
- Campaign type changes the tolerance. A four-day flash sale to a warm audience can run at a high frequency and still convert. An always-on prospecting campaign to a small audience will burn out far sooner.
- Audience size changes the pace. A narrow audience hits high frequency quickly because there are fewer unique people to reach. A broad audience climbs slowly.
- The trend is the real signal. Frequency on its own is just exposure. It only becomes a fatigue warning when it rises at the same time your efficiency metrics fall.
So the right question is not “is this number high” but “is frequency climbing while performance drops.” That is what you read next.
The metric combination that signals creative burnout
Ad fatigue is a story told by four metrics moving together over the same window. Read them as a group.
- Frequency rising. People are seeing the ad more often. On its own, neutral.
- CTR falling. CTR = clicks / impressions. When the same audience stops clicking, the creative has lost its pull. This is usually the first metric to crack.
- CPM rising. CPM = spend / impressions times 1000. Meta tends to charge more to keep showing a fatigued ad to a saturated audience.
- Cost per result rising. Cost per lead = spend / leads, or cost per purchase = spend / purchases. This is where fatigue finally reaches the bottom line and starts pulling ROAS down.
When frequency goes up and the other three move the wrong way across the same period, that is creative burnout. When frequency rises but CTR holds and cost per result stays flat, the audience is still responding and there is nothing to fix. Read them together or you will misjudge it. For how the result metrics differ, see ROAS vs CPL vs CPA explained.
Use trend charts to find the exact week it started
A monthly total hides fatigue because the strong early weeks average out the weak later ones. A trend chart does not.
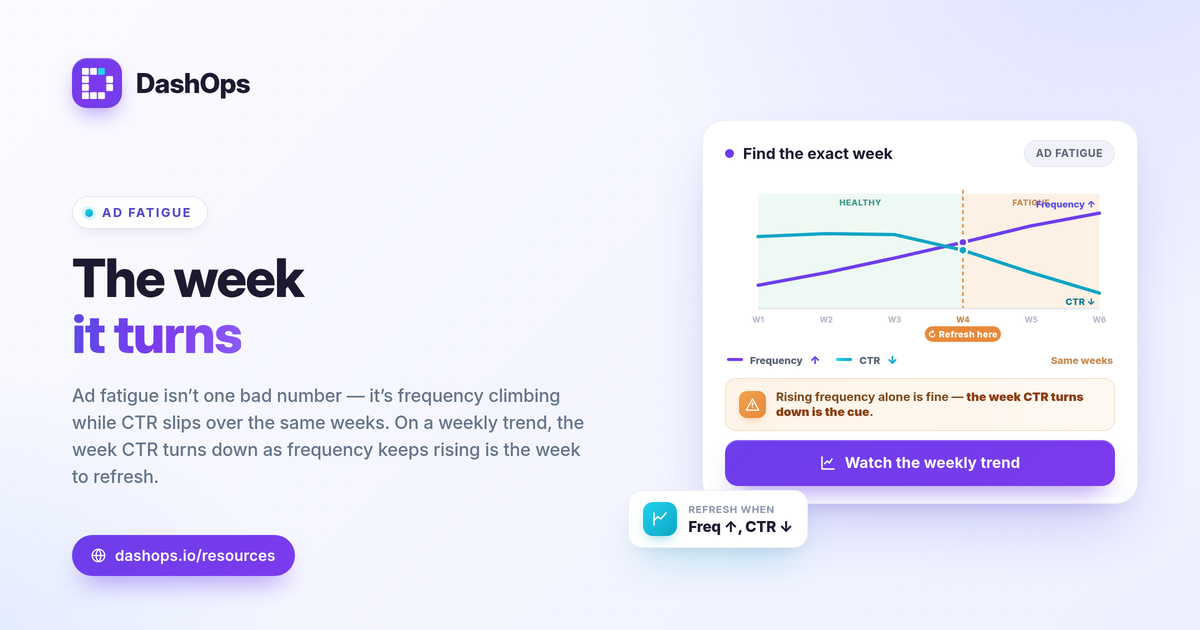
- Plot week over week, not just the period total. Frequency and CTR on a weekly trend make the crossover point obvious: the week frequency keeps rising but CTR turns down is the week fatigue set in.
- Line up the metrics on the same timeline. When the CTR dip, the CPM bump, and the cost per result climb all land in the same week as a frequency jump, you have your answer and your date.
- Use period-over-period comparison for context. Comparing this period against the last tells you whether the slide is a one-week blip or a sustained decline worth acting on.
This is the difference between a reporting dashboard and the native interface. Pulling the raw numbers in Ads Manager shows you the totals; a trend view shows you the turn. We cover that gap in Facebook Ads Manager vs a reporting dashboard.
When to refresh creative, and what to change
Once the trend confirms fatigue, the fix is new creative, not a bigger budget against the tired ad. Throwing more spend at a fatigued ad usually just raises frequency faster.
- Refresh on the data, not the calendar. The cue to refresh is the sustained crossover: frequency up, CTR and cost per result moving against you for more than a single week.
- Change the creative, not only the copy. New visuals and hooks give the algorithm a fresh asset to test against the same audience.
- Consider the audience too. If frequency is high because the audience is small, widening targeting can lower frequency and slow the next round of fatigue.
- Watch the same four metrics after the swap. A genuine refresh shows up as frequency resetting lower and CTR recovering. If it doesn’t, the problem may be the offer, not the creative.
One caution on the numbers themselves: iOS privacy changes cause Meta to undercount some conversions, so cost per result can look worse than reality. Frequency, impressions, reach, and CTR are delivery metrics and are not affected the same way, which is part of why CTR is such a reliable early fatigue signal.
Watch fatigue across every account, not one at a time
If you run more than one ad account, fatigue rarely arrives everywhere at once, and checking each account by hand is how a slide goes unnoticed for a week. DashOps reads frequency alongside CTR, CPM, and cost per result for all your Meta ad accounts in one dashboard, with period-over-period comparison and trend charts that surface the exact week performance turns. Demographic and placement breakdowns help you see whether fatigue is concentrated in one segment. See what each plan includes on the pricing page, and the help center walks through connecting an account. To choose which metrics to keep in view, the Meta Ads KPIs to track guide is a good companion. If you report to clients, white-label reports let you show the fatigue story cleanly, covered in white-label client reporting.
The practical takeaway: stop hunting for a magic frequency number and instead watch frequency, CTR, CPM, and cost per result move together on a weekly trend, because the week they diverge is the week to refresh.
Frequently asked questions
What frequency is too high on Facebook ads?
Does high frequency always mean ad fatigue?
How often should I refresh creative to avoid fatigue?
See it in your own dashboard
DashOps brings Meta Ads reporting, campaign management, and white-label client portals into one place. Pick the plan that fits how you run ads.