7 Audience Breakdown Reports Every Meta Ads Advertiser Should Run Monthly
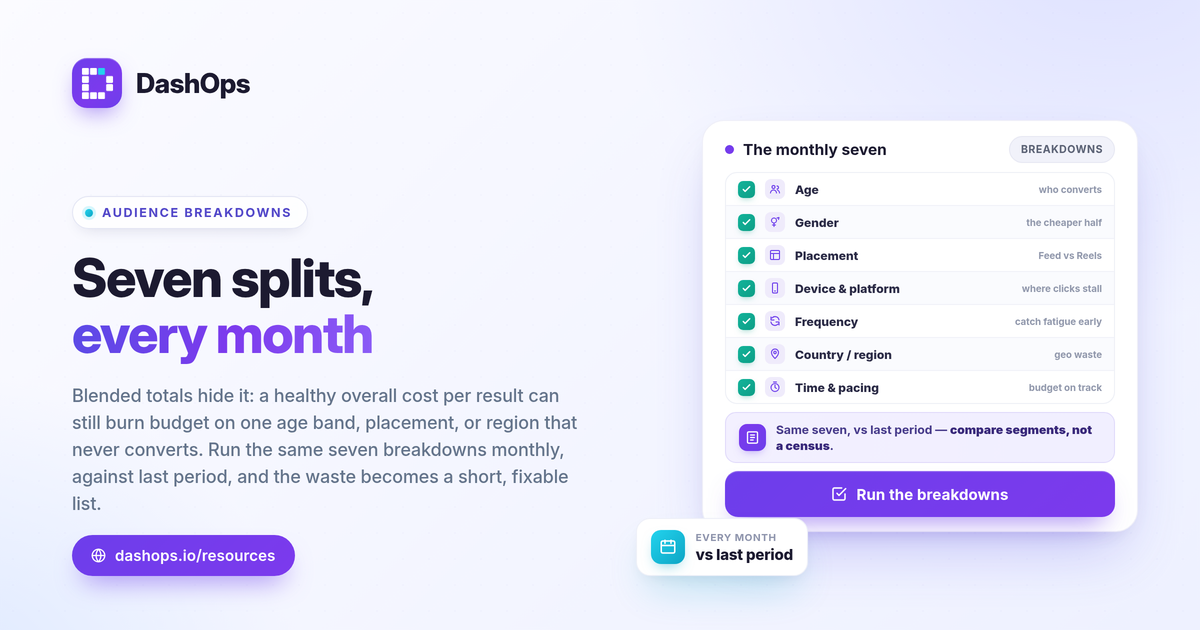
A Meta Ads audience breakdown report splits your results by a single attribute, age, gender, placement, device, or region, so you can see which slices of your audience earn their budget and which quietly burn it. The blended totals in your dashboard hide this. A campaign with a healthy overall cost per result can still be wasting a real share of its spend on one age band or one placement that never converts. Running the same set of breakdowns every month turns that hidden waste into a short, fixable list. Below are seven Meta Ads audience breakdown reports worth running on a fixed monthly cadence, what each one reveals, and how to act on it.
Why monthly breakdowns beat one blended number
A single cost per result tells you whether the account is fine. It does not tell you where the money went or what changed. A Facebook Ads audience segmentation report answers the second question, and that is the one that leads to action.
- Segments hide inside averages. A healthy blended ROAS can be one strong segment carrying two others sitting near zero, and the average hides all three.
- Waste compounds quietly. A placement that never converts keeps spending every day until someone looks.
- Trends matter more than snapshots. The same breakdown month over month shows whether a segment is improving, decaying, or fatiguing.
Run these against the prior period every time. A number in isolation is a guess. A number next to last month is a decision.
1. Age breakdown
Split spend and results by age band. This is the fastest way to find budget flowing to people who click but do not convert.
- Look at cost per result and ROAS or cost per lead per age band, not just impressions.
- Flag any band taking meaningful spend with a result rate well below the others.
- Before excluding a band, check volume. A band with very few conversions may just need more data, not removal.
2. Gender breakdown
The gender split often surfaces a quiet imbalance, where one segment absorbs most of the spend while the other delivers the cheaper results.
- Compare cost per result by gender side by side.
- If one segment is consistently more efficient across several months, that is a signal to shift budget, not a one-month fluke to chase.
- Pair this with the age view. The combination of age and gender usually tells a sharper story than either alone, which is covered in more depth in our age and gender breakdown guide.
3. Placement breakdown
Placement is where demographic and placement reporting earns its keep. Meta spreads delivery across Feeds, Stories, Reels, Audience Network, and more, and these placements rarely perform the same.
- Compare cost per result by placement, then check what share of spend each one takes.
- A placement with high spend and poor results is the clearest waste signal in the whole account.
- Before cutting a placement, remember some low-cost placements feed the funnel. Judge them against the goal, not on cost per result alone.
For a fuller walkthrough of reading these views, see our placement performance comparison.
4. Device and platform breakdown
Mobile and desktop, iOS and Android, Facebook and Instagram: these often behave like different audiences. A device and platform breakdown shows whether your landing experience holds up everywhere you pay to send traffic.
- Watch for a platform with strong clicks but weak conversions. That gap usually points at the landing page or form on that device, not the ad.
- A large cost per result gap between mobile and desktop is worth a manual check of the destination on the weaker device.
5. Frequency check
Frequency is the average number of times each person saw your ads. It is a real KPI in your dashboard, and watching it over time is how you catch fatigue before the numbers fall apart.
- Rising frequency alongside a rising cost per result and a falling CTR is the classic fatigue pattern.
- One number is meaningless on its own. The trend across the month, against last month, is the signal.
- When frequency climbs and efficiency drops together, it is a prompt to refresh creative or widen the audience.
Our explainer on reach, impressions, and frequency covers how these three relate.
6. Country and region breakdown
If you run in more than one location, a country and region breakdown often hides the loudest waste in the account, especially on broad or lookalike targeting that drifts wider than intended.
- Compare cost per result by region, then check spend share.
- A region pulling spend with no conversions is usually an easy exclusion.
- For local or service businesses, this view confirms that budget is staying inside the area you actually serve.
7. Time and pacing context
Breakdowns answer where the money went. Pacing answers whether the total is on track for the month. Read them together so a segment fix does not quietly blow the budget.
- Check spend pacing against your monthly budget so you know how much room a reallocation has.
- Note any mid-month spike that might explain a sudden shift in a breakdown.
How to judge what is good
None of these reports come with a universal pass mark, and any number claiming one should be treated with suspicion. Judge each segment three ways:
- Against your own goal. Compare cost per result to your target cost per lead or your break-even ROAS, which is 1 divided by your profit margin.
- Against the other segments. Within one breakdown, the best and worst performers define the spread worth acting on.
- Against the prior period. A segment getting more expensive month over month matters even if it still technically clears your target.
One honest caveat: conversion-based breakdowns can be undercounted because of iOS and ATT changes, which attribute some results to fewer segments than truly drove them. Use breakdowns to compare segments and trends, not as a precise census. For the metrics behind these views, our guide to the Meta Ads KPIs worth tracking is a good companion.
Where DashOps fits
Pulling every one of these breakdowns from Ads Manager by hand, across multiple ad accounts, is the slow part. DashOps reads demographic, placement, and frequency breakdowns with period-over-period comparison in one dashboard, and packages them into PDF, Excel, or white-label client reports without rebuilding the view each month. See what each plan includes on the pricing page, and the help center walks through connecting an account. If you report to clients, our note on white-label client reporting shows how these breakdowns travel into a branded report.
The takeaway: run the same seven breakdowns every month against the prior period, and waste stops hiding inside your averages.
Frequently asked questions
What are Meta Ads audience breakdown reports?
How often should I run audience breakdown reports?
Why do my breakdown numbers not match my total spend exactly?
See it in your own dashboard
DashOps brings Meta Ads reporting, campaign management, and white-label client portals into one place. Pick the plan that fits how you run ads.