Age and Gender Breakdown in Meta Ads: What the Data Means and How to Act on It
The age and gender breakdown in Meta Ads tells you which slices of your audience actually drove results, not just who saw your ads. It splits spend, impressions, clicks, and conversions across age bands and gender, so you can see whether a 25 to 34 woman cost less per purchase than a 45 to 54 man, or whether one segment is quietly eating budget without converting. Read correctly, it points you toward better creative and budget decisions. Read carelessly, it pushes you to over-narrow targeting and starve the algorithm. This guide explains what the splits mean and how to act on them.
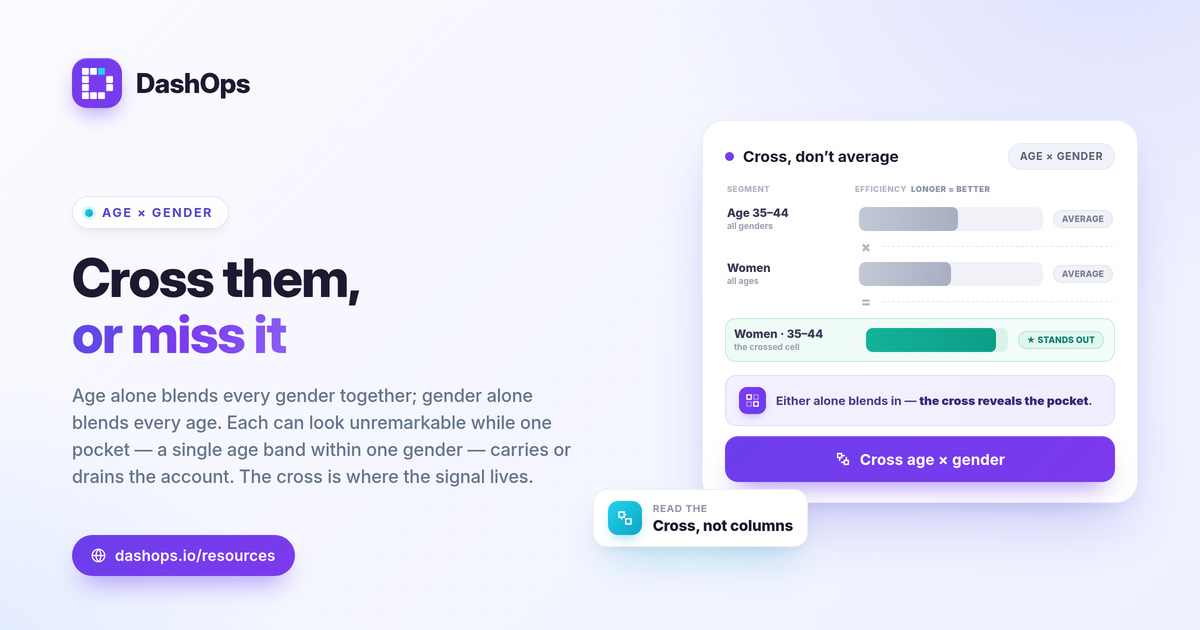
What the age and gender breakdown actually shows
Meta groups your audience into standard age bands (such as 18 to 24, 25 to 34, 35 to 44, and up) and gender (female, male, and unknown), then reports your metrics inside each cell. A demographic breakdown dashboard lets you view spend, impressions, reach, clicks, CTR, CPC, CPM, and results per segment in one place.
The key thing to understand: these splits describe where performance landed inside the audience you already targeted. They are an outcome, not an instruction. If you targeted a broad audience, the breakdown shows who Meta’s delivery found and where they converted. That is useful information, but it is not the same as telling you to exclude everyone else.
Volume versus efficiency: read both, not one
The most common mistake in reading Meta Ads demographics is judging a segment by how much it spent or how many clicks it got. A segment can pull a large share of impressions and clicks while delivering almost no results.
Always pair a volume metric with an efficiency metric:
- Volume. Spend, impressions, clicks, and total results in the segment.
- Efficiency. Cost per result in that segment, calculated the same way as the account: cost per lead = spend / leads, or cost per purchase = spend / purchases.
- Return. ROAS for sales (conversion value / spend), or pipeline value for lead gen.
A 35 to 44 segment that spent a third of your budget but produced your cheapest cost per purchase is carrying the account. An 18 to 24 segment with the most clicks and the worst cost per result is a candidate to investigate, not necessarily to cut.
What the splits are really telling you
Facebook Ads age demographics and gender targeting performance usually surface one of three patterns. Each calls for a different response.
- A segment converts well and cheaply. This is your core buyer. The signal is to feed it: make sure your creative speaks to that group and that budget is not being held back by a structure that limits delivery to them.
- A segment gets reach but few results. This is an efficiency drag. Before excluding it, ask whether the creative simply does not resonate with that group. The fix is often a new ad, not a narrower audience.
- A surprising segment performs. Meta’s delivery frequently finds buyers in age or gender ranges you would not have chosen. This is the strongest argument for keeping audiences broad and letting the breakdown reveal demand you did not expect.
Turning the data into decisions
Reading Meta Ads demographics only matters if it changes what you do next. Three moves cover most cases.
- Adjust creative before targeting. If older segments convert and your ads feature only younger imagery and language, the message is the lever. Test creative aimed at the segment that already buys. This usually beats slicing the audience thinner.
- Be slow to exclude. Narrowing by age or gender removes signal the algorithm uses to find more buyers. Only exclude a segment when it consistently spends with no return across several periods, not after one weak week. A small sample can swing a single segment dramatically.
- Match the offer to who shows up. If a segment you did not expect keeps converting, that is market feedback. Consider whether your offer, landing page, or product framing should lean into that audience rather than fight it.
To compare segments fairly, decide up front which result metric governs the account. If you are unsure whether to optimize against cost per lead, cost per acquisition, or return, ROAS vs CPL vs CPA explained walks through which fits which goal.
How to judge whether a segment is “good”
There is no universal number that makes an age or gender segment good. A cost per lead that is healthy for one business is unaffordable for another, because it depends on your margin and what a customer is worth to you.
Judge each segment three ways:
- Against your own goal. Compare its cost per result to the maximum you can pay and stay profitable. For sales, your floor is break-even ROAS = 1 / profit margin.
- Against the account average. Is this segment pulling the blended cost per result up or down?
- Against its own trend. A period-over-period comparison shows whether a segment is improving or decaying. A segment getting more expensive each period, often alongside rising frequency, can signal fatigue in that audience.
Why the numbers may not reconcile
Two limits matter when reading the breakdown. First, Meta cannot always attribute a result to a demographic, so the segment rows often sum to less than your account total. Second, iOS privacy changes cause undercounting of conversions, which means demographic splits understate true results, especially for purchases. Treat the breakdown as a proportional signal of where performance concentrates, not an exact ledger, and reconcile totals against your own sales or CRM data.
DashOps surfaces the age and gender breakdown alongside placement breakdowns, frequency, and period-over-period trends in one dashboard, with adaptive KPIs for lead gen or e-commerce so you compare each segment by the metric that matters to your goal. You can see what each plan includes on the pricing page, and the help center covers connecting your ad accounts. For the full set of metrics worth watching, see Meta Ads KPIs to track, and if you report to clients, white-label client reporting shows how to present these splits cleanly.
The takeaway: use the age and gender breakdown to guide creative and budget pressure first, and reach for the exclude button only after a segment proves itself a drag across several periods.
Frequently asked questions
Does an age and gender breakdown in Meta Ads mean I should narrow my targeting?
Which metric should I judge each age and gender segment by?
Why does the age and gender data not add up to my total conversions?
See it in your own dashboard
DashOps brings Meta Ads reporting, campaign management, and white-label client portals into one place. Pick the plan that fits how you run ads.