Lead Gen Facebook Ads Report Template: Tracking Leads and Cost Per Lead for Clients
A lead gen Facebook Ads report template should answer one question for whoever reads it: how many leads did the spend produce, and at what cost. Everything else supports that. The strongest version is built around three numbers the client actually cares about, leads, cost per lead, and the trend against last period, then layered with Instant Forms detail and a campaign breakdown. Below is a Meta Ads lead report template you can copy into a spreadsheet or wire up to pull automatically, plus the reasoning behind each section so it holds up when a client asks why a number moved.
Start with the three numbers that matter
Open with the metrics tied to the goal, not every field Meta returns. For lead gen, that means:
- Leads. The total count of form submissions or conversions in the period.
- Cost per lead. Spend divided by leads. This is the headline efficiency number.
- Spend. What you put in, so the other two have context.
Put these at the top as large figures with the prior period beside each. A cost per lead report template that shows this month next to last month answers the client’s real question before they ask it. A single number hides the story; the comparison shows whether things got better or worse.
Add the period-over-period trend
A number on its own is hard to judge. Whether a cost per lead is good depends on your margin, your follow-up close rate, and where it was last month, not on a universal benchmark. So show direction.
- Leads this period vs last period. Up or down, and by how much.
- Cost per lead this period vs last period. Falling cost per lead at steady volume is the signal you want.
- Spend this period vs last period. So a change in lead volume can be read correctly. More leads on more spend is different from more leads on flat spend.
DashOps builds period-over-period comparison into every KPI, so the lead and cost per lead deltas are already calculated for you. If you want a primer on which fields to track, see the Meta Ads KPIs to track guide.
Break it down by campaign
The summary tells the client the headline. The campaign breakdown tells you where to act. Add a simple table:
| Campaign | Spend | Leads | Cost per lead |
|---|---|---|---|
| Acme Apparel - Search intent | … | … | … |
| Globex Outdoor - Lookalike | … | … | … |
| Contoso Studios - Retargeting | … | … | … |
Sort by cost per lead. The cheapest campaigns show you where to add budget; the most expensive show you where to investigate or cut. This is the section that turns a report from a status update into a decision.
Layer in Instant Forms data
If your leads come through Meta Instant Forms, the report should reflect how that data behaves. Two things matter here.
First, lead volume trends. Track form submissions over time alongside spend so you can see whether a rising cost per lead is a creative problem or simply a quieter week.
Second, the export. Meta only lets you download Instant Form leads directly from the Page for a limited window, about 90 days, after which the leads have to be retrieved through the API or a connected tool. If your reporting depends on pulling that CSV by hand, you are on a clock. Building a regular export into your routine keeps leads from aging out. DashOps captures Instant Forms leads and exports them to CSV or Excel, which removes the manual deadline. The Meta Instant Forms lead capture post covers how that works.
Address lead quality, not just lead cost
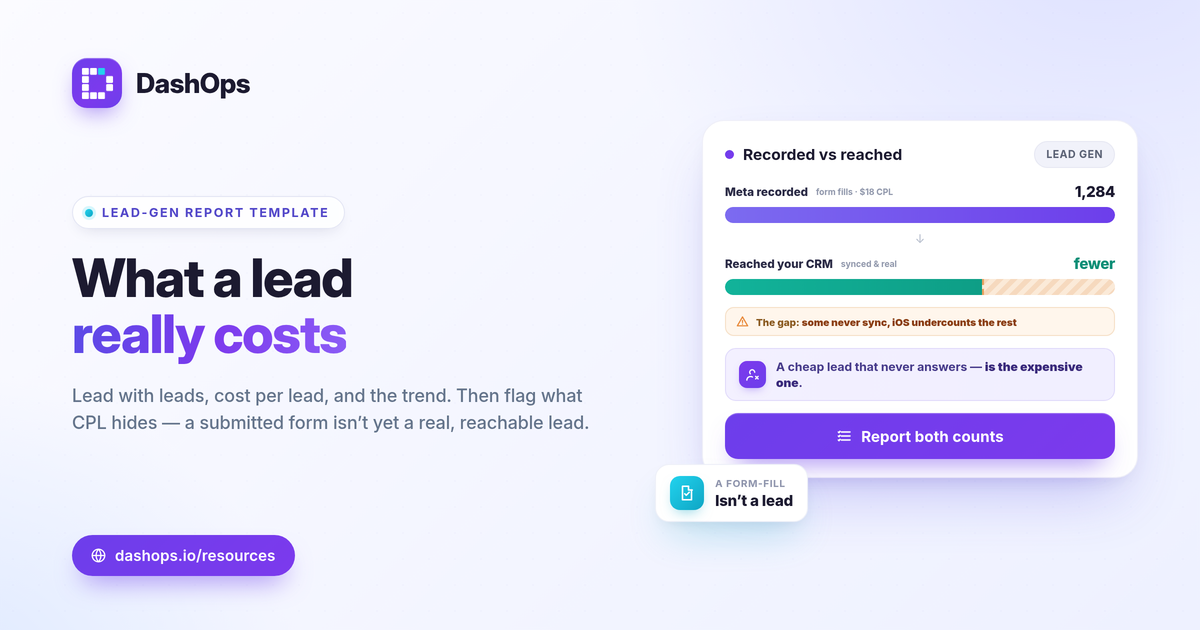
Cost per lead measures what you paid to get a form filled out. It says nothing about whether those leads were real, reachable, or close-ready. A cheaper lead that never answers the phone is more expensive than a pricier one that books a call.
You cannot pull close rates from Meta, but you can frame the gap honestly in the report:
- Note the volume. How many leads Meta recorded.
- Note what reached the CRM. If you sync leads to a CRM, the count that arrived and passed filtering.
- Flag the difference. Some leads never sync, and iOS privacy changes cause undercounting in Meta’s reported conversions, so the two numbers rarely match exactly. Explaining that gap builds more trust than hiding it.
For a deeper split between counting leads and judging them, ROAS, CPL and CPA each answer a different question; the ROAS vs CPL vs CPA explained post breaks that down.
Make it repeatable
A Facebook lead ads reporting template is only useful if you can produce it again next month without rebuilding it. Two ways to get there:
- Spreadsheet version. Recreate the sections above in Sheets or Excel, then update the figures each period. Free, but you copy numbers by hand every time, which is where errors and aged-out leads creep in.
- Automated version. Connect the ad account once and let the dashboard pull leads, cost per lead, spend, the period comparison, and the campaign breakdown on its own. The report stays current without manual exports.
If you are weighing the manual route against a live dashboard, the Facebook Ads Manager vs reporting dashboard comparison lays out the trade-offs.
Deliver it cleanly to clients
If this report goes to a client, presentation matters. A white-label PDF or a read-only share link reads as more finished than a raw spreadsheet, and a scheduled email digest means you never forget to send it. The white-label client reporting guide walks through branding the output.
DashOps pulls leads, cost per lead, spend, and the period-over-period trend across all your Meta ad accounts into one dashboard, with adaptive lead-gen KPIs, Instant Forms export, and white-label PDF and share-link delivery, so the template above becomes a live report instead of a monthly rebuild. See what each plan includes on the pricing page, and the help center covers connecting an account and scheduling reports.
Start with leads, cost per lead, and the trend; everything else in the report exists to explain those three.
Frequently asked questions
What should a lead gen Facebook Ads report include?
How do I calculate cost per lead from Facebook Ads?
Why do my CRM lead numbers not match Facebook's?
See it in your own dashboard
DashOps brings Meta Ads reporting, campaign management, and white-label client portals into one place. Pick the plan that fits how you run ads.