What KPIs Should a Facebook Ads Report Template Include? A Field-by-Field Breakdown
A Facebook Ads report template should include the metrics that map to your goal, grouped so the reader can answer one question fast: did the spend work, and what changed. The core Facebook Ads report template KPIs are spend, results, CPC, CTR, CPM, and either ROAS (for sales) or CPL (for lead gen), arranged from headline outcome down to diagnostic detail. The trick is not listing every number Meta returns. It is choosing the few KPIs that explain the result and putting each one where it belongs. Below is a field-by-field breakdown of what to include in a Facebook Ads report and why each metric earns its place.
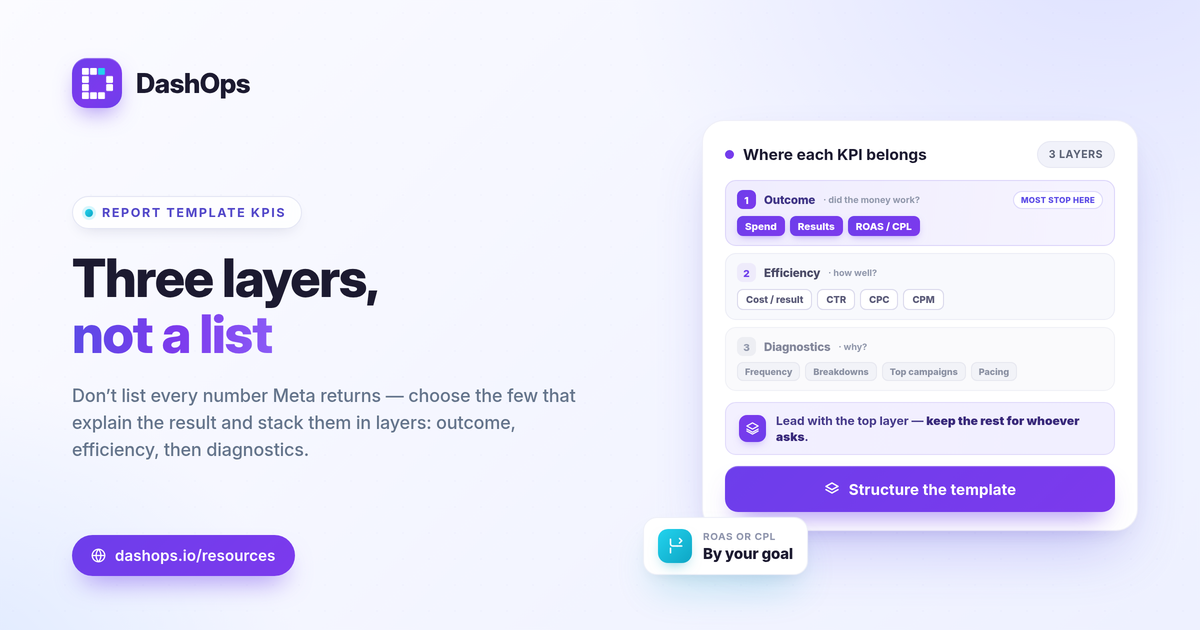
The three-layer structure every template needs
Before the field list, decide the shape. A report that holds up reads top to bottom in three layers, so the reader never has to hunt.
- Layer 1: outcome. Spend, results, and return. This answers did the money work.
- Layer 2: efficiency. Cost per result, CTR, CPC, CPM. This answers how efficiently it worked.
- Layer 3: diagnostics. Frequency, demographic and placement breakdowns, top campaigns. This answers why it worked or did not.
Most readers only need Layer 1. Keep the detail available for anyone who asks, but lead with the outcome. For a deeper view of which metrics matter most, see the Meta Ads KPIs to track guide.
Layer 1: the outcome KPIs
These belong at the very top of the template, side by side with the prior period.
- Spend (amount spent). The total you put behind the ads in the period. Every other number is read against this.
- Results. Purchases for e-commerce, leads for lead gen. This is the thing you were paying to produce.
- ROAS (for sales). Return on ad spend, calculated as conversion value divided by spend. ROAS = conversion value / spend. It tells you what each unit of spend returned.
- CPL (for lead gen). Cost per lead, calculated as spend divided by leads. CPL = spend / leads. The lead-gen equivalent of efficiency at the outcome level.
If your account is lead gen, ROAS will not apply and CPL takes the lead seat. If it is e-commerce, the reverse. DashOps shows adaptive KPIs so the report surfaces the right one automatically, and the ROAS vs CPL vs CPA explained post covers when to use each.
Layer 2: the efficiency KPIs
These explain how the outcome was reached and where the cost sits. Place them in a clean row or small table directly under the outcome.
- Cost per result. Cost per purchase or cost per lead, depending on the goal. The single most useful efficiency number for most readers.
- CTR (click-through rate). Clicks divided by impressions. CTR = clicks / impressions. A read on whether the creative and audience are compelling enough to earn the click.
- CPC (cost per click). Spend divided by clicks. CPC = spend / clicks. Rising CPC with flat results usually points to creative or auction pressure.
- CPM (cost per 1,000 impressions). Spend divided by impressions, times 1,000. CPM = spend / impressions x 1000. The price of reaching the audience, useful for spotting auction cost changes.
A quick note on definitions: link clicks and landing page views are not the same, and mixing them quietly distorts CTR and CPC. Pick one and label it. The link clicks vs landing page views post explains the difference.
Layer 3: the diagnostic KPIs and breakdowns
This is where a report stops being a scoreboard and starts explaining itself. Include these below the fold or on a second page.
- Frequency. Average times each person saw your ads. A climbing frequency alongside a softening CTR is the classic fingerprint of creative fatigue.
- Demographic breakdown. Age and gender performance, so you can see which segments carry the result and which drain spend.
- Placement breakdown. Feed, Stories, Reels and other placements compared, so you can see where the efficient impressions actually came from.
- Top campaigns. The handful of campaigns doing the heavy lifting, ranked by spend or result.
- Spend pacing. Whether you are on track to spend the planned budget, or running hot or cold against it.
These are the fields that turn a question into an answer. When a client asks why CPL rose, the demographic and placement breakdowns plus frequency usually hold the reason.
Period-over-period: the column that makes it a report
A single column of numbers is a snapshot, not a report. Every KPI in the template should sit next to its prior-period value and the change between them. That comparison is what a reader actually wants: is this month better than last, and by how much.
This also solves the hardest framing question in Meta Ads reporting: what counts as good. There is no universal benchmark that fits every account, margin, and offer. Judge each KPI against your own goal, your profit margin, and last period’s trend. For e-commerce, your break-even ROAS is a real anchor: break-even ROAS = 1 / profit margin. Anything above it is profit, anything below is loss. That is a far more honest standard than a number copied from someone else’s account.
One caveat to label in every template
Meta’s reported conversions are modeled and can undercount, especially since iOS privacy changes reduced the signal Meta receives. Your reported purchases or leads may run lower than what your store or CRM records. You do not need to fix this in the report, but you should note it, so the reader does not treat Meta’s number as the final word. Reconciling against actual sales is a separate, healthy habit.
A clean template also handles the practical side of leads. Meta only lets you download Instant Form leads directly from the Page for a limited window, about 90 days, after which leads must be pulled through the API or a connected tool. If lead volume is part of your report, plan to export on a schedule rather than relying on that window.
Putting the template to work
Once the fields are set, the work is keeping them current without rebuilding the layout every cycle. DashOps reads all 17-plus of these KPIs across your Meta ad accounts in one dashboard, with period-over-period comparison, demographic and placement breakdowns, and adaptive lead-gen or e-commerce KPIs already wired in, then exports to PDF, Excel or CSV and white-label client reports. See what each plan includes on the pricing page, and the help center walks through connecting an account. If your reports go to clients under your own brand, the white-label client reporting guide covers the options. For a sense of when a dashboard beats Ads Manager exports, the Ads Manager vs reporting dashboard comparison is a useful read.
Start with the outcome KPIs, add efficiency and diagnostics in layers, and always pair every number with its prior period so the report answers the only question that matters.
Frequently asked questions
What KPIs should a Facebook Ads report template include?
Should a Meta Ads report show ROAS or cost per lead?
How do I know if a Facebook Ads KPI is good in a report?
See it in your own dashboard
DashOps brings Meta Ads reporting, campaign management, and white-label client portals into one place. Pick the plan that fits how you run ads.