Facebook Lead Ads Reporting for Insurance and Solar: Cost Per Lead Across High-Ticket Campaigns
Facebook lead ads reporting for insurance and solar comes down to one number that decides whether the campaign works: cost per lead, read against what those leads are actually worth. Because insurance and solar are high-ticket, a single qualified lead can justify a much higher acquisition cost than a low-ticket offer, so the headline figure has to be paired with lead quality and close value, not judged in isolation. The reporting job is to track cost per lead cleanly per ad account, watch the trend over time, and make sure every lead is captured before Meta’s retention window closes. Here is how to build that report and protect the leads behind it.
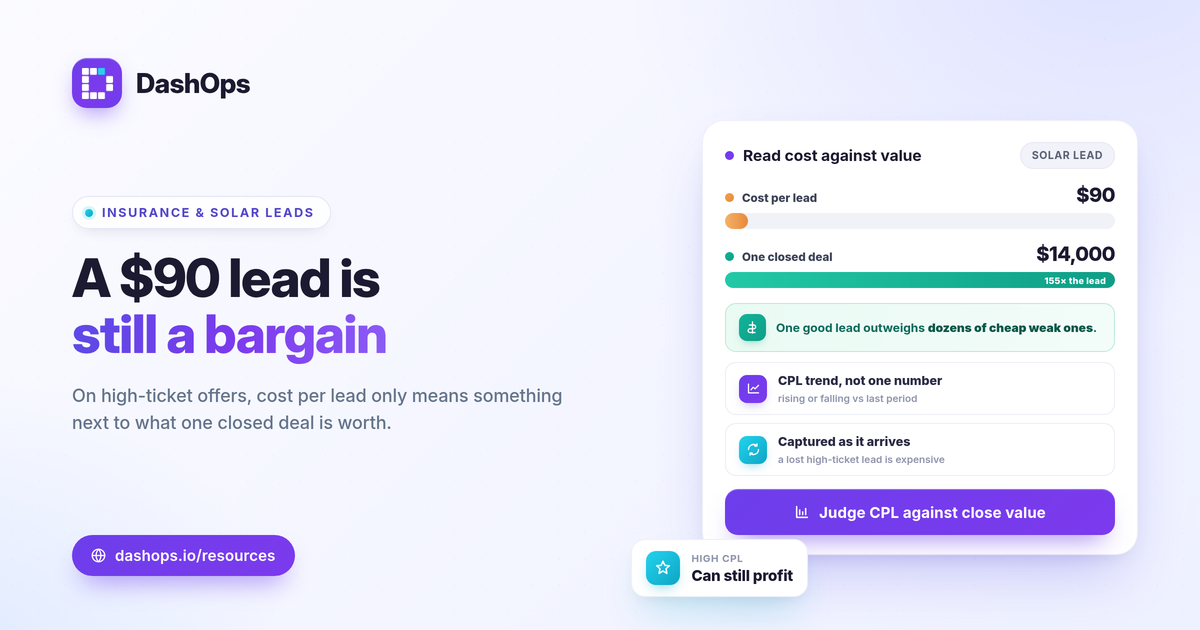
Start with cost per lead, but read it in context
For a high ticket lead gen dashboard, the metric that matters is cost per lead, calculated as spend divided by leads for the period you are measuring. That formula is simple. The judgment is not.
- Spend and leads, side by side. What you put into each campaign and how many leads it returned.
- Cost per lead per offer. Insurance cost per lead Facebook campaigns and solar lead reporting Meta campaigns rarely behave the same, so report them separately rather than blending into one average.
- Trend, not just total. A cost per lead of any value means little alone. What matters is whether it is rising or falling versus the prior period.
There is no universal “good” cost per lead for insurance or solar. A figure that looks high can still be profitable if those leads close at a high enough value, and a low cost per lead means nothing if the leads never convert. Judge it against your own margin, your close rate, and your previous months, which is exactly what a period-over-period view is for. If you want the broader metric context, the KPIs worth tracking in Meta Ads covers the supporting numbers.
Separate volume from quality
Cost per lead measures efficiency, not value. Two campaigns can report the same cost per lead while one fills your pipeline with people ready to buy and the other delivers tire-kickers. High-ticket offers feel this gap more sharply because one good solar or insurance lead can outweigh dozens of weak ones.
- Lead volume trend. Are you getting more or fewer leads, and is that change tied to spend or to fatigue?
- Cost per lead trend. Whether efficiency is holding as you scale budget.
- Quality signal. Cost per lead lives in the dashboard, but quality lives in your CRM or sales notes. Report cost per lead next to your own downstream close data so the two are never confused.
The practical move is to treat the dashboard number as the input cost and your CRM as the outcome. If you are weighing these ideas against each other, the difference between ROAS, CPL and CPA lays out which metric answers which question.
Use breakdowns to find where the cheap leads hide
High-ticket campaigns reward segmentation. A single account-level cost per lead can mask the fact that one age band, gender, or placement is carrying the whole result while another quietly wastes budget.
- Demographic breakdown. Age and gender breakdowns show which segments produce leads at a workable cost. Solar intent and insurance intent often skew toward particular age ranges, and the data tells you which.
- Placement breakdown. Feed, Stories, Reels and other placements can return very different cost per lead figures for the same offer.
- Frequency as a fatigue signal. When the same audience sees your ad too often, cost per lead tends to climb. Frequency reported alongside cost per lead helps you spot fatigue before it eats the budget, which matters more for narrow high-ticket audiences that saturate quickly.
These breakdowns turn one flat number into a map of where to push budget and where to pull back.
Protect the leads: Meta’s retention window is short
For insurance and solar, a lost lead is expensive, so lead protection is part of reporting, not an afterthought. There is a real platform constraint to plan around. Meta only lets you download Instant Form leads directly from the Page for a limited window, about 90 days, after which the leads must be retrieved through the API or a connected tool. If you rely on manually pulling a CSV from the Page now and then, older leads can age out of that window and become much harder to recover.
- Capture continuously. Connect your Instant Forms so leads flow into one place as they come in, instead of sitting on the Page waiting to expire.
- Export to a clean record. Pull your captured leads to CSV or Excel for your own archive and for handoff to sales, so nothing lives only inside Meta’s window.
- Keep reporting on a schedule. Scheduled email digests and white-label client reports keep the cost per lead picture in front of you and your clients without a manual pull every week.
DashOps captures Meta Instant Form leads as they come in and supports CSV and Excel export, so the leads behind your cost per lead number do not quietly age out of Meta’s window. For more on the export mechanics, see exporting Meta Instant Form leads to CSV.
Account for under-reporting before you panic
Cost per lead from Instant Forms is generally stable because the lead is captured on Meta itself. If you also run campaigns that send people to a landing page and rely on the pixel, expect some undercounting. Since iOS app tracking changes, Meta tends to under-report conversions that happen off-platform, which can make landing-page lead campaigns look worse than they are. Instant Forms sidestep much of this because the form submission is a native Meta event. When you compare cost per lead across campaign types, keep that difference in mind rather than assuming the on-site campaign is failing.
Report cost per lead per account and per client
Insurance and solar advertisers often run several ad accounts, whether across regions, offers, or clients. Reporting each one separately, then rolling them up, keeps the cost per lead insurance solar picture honest. Agencies, in-house teams, and solo advertisers managing this for others or for themselves can present it cleanly without exposing the raw ad account. For comparing what the dashboard adds over the native tool, Ads Manager versus a reporting dashboard walks through the trade-offs, and white-label client reporting covers presenting these numbers under your own brand.
DashOps reads every Meta KPI, including cost per lead with period-over-period comparison, across your ad accounts in one dashboard, with demographic and placement breakdowns, Instant Form lead capture with CSV and Excel export, scheduled email digests, and white-label client reports. See what each plan includes on the pricing page, and the help center covers connecting your accounts and Instant Forms.
The takeaway: for high-ticket lead gen, track cost per lead against your own close value and trend, capture every Instant Form lead as it comes in, and export your leads so nothing ages out of Meta’s retention window.
Frequently asked questions
How do I calculate cost per lead for insurance and solar Facebook campaigns?
Why is my Facebook cost per lead higher for solar than other industries?
How do I stop losing Facebook Instant Form leads from insurance and solar campaigns?
See it in your own dashboard
DashOps brings Meta Ads reporting, campaign management, and white-label client portals into one place. Pick the plan that fits how you run ads.