Facebook Ads Dashboard Template in Looker Studio: Setup Guide and Free Template
A Facebook Ads dashboard template in Looker Studio is a pre-built report you copy into your own Google account, point at your Meta Ads data, and start using in minutes instead of building from a blank canvas. The fastest path is: get a Meta connector, make a copy of a shared template, swap in your own data source, and adjust the date range. Looker Studio (the tool Google renamed from Google Data Studio) is free, so the real work is the connection and the upkeep. Below is the full setup, a free template structure you can recreate, the KPIs worth keeping, and an honest note on where the manual refresh stops scaling.
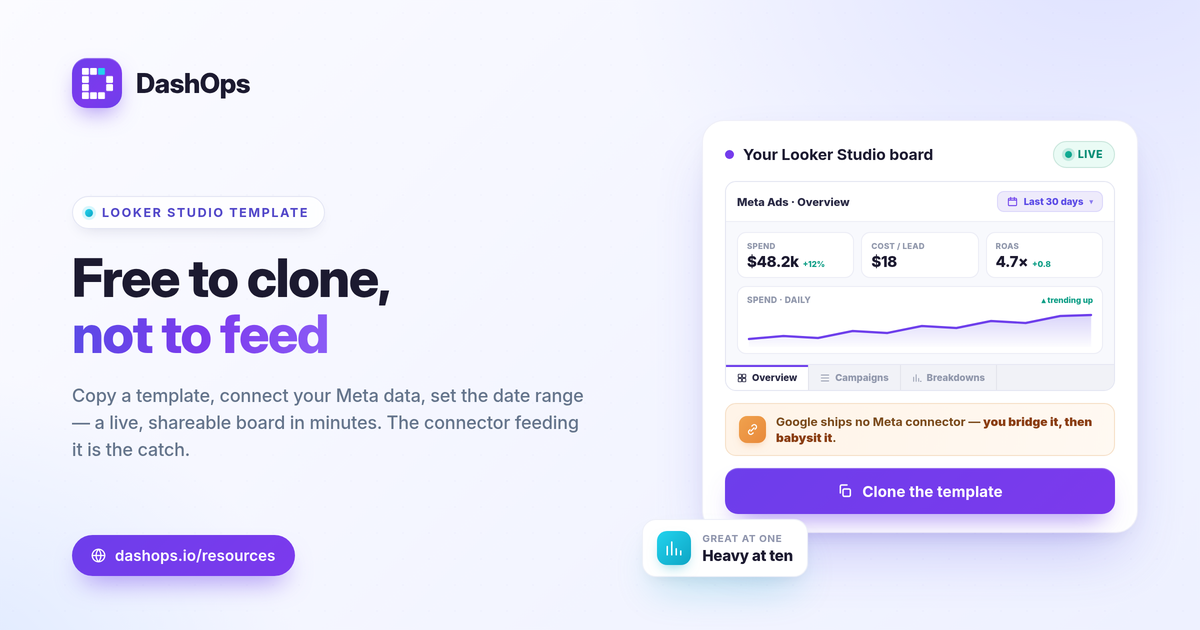
How to connect Meta Ads to Looker Studio
Looker Studio does not ship a native Facebook or Instagram Ads connector. Google connects to its own products out of the box, but Meta is a third party, so you bridge the gap one of three ways:
- Community connector (free, limited). Several free Meta Ads connectors exist in the Looker Studio connector gallery. They work, but tend to cap on rows, fields, refresh frequency, or number of accounts, and some go dormant when Meta changes its API version.
- Paid connector (per data source). Dedicated connector tools charge per Meta ad account or per data source. This is the reliable route at scale, and it is where the “free” Looker Studio dashboard quietly stops being free. To compare that trade-off, see Looker Studio vs a dedicated Facebook Ads dashboard.
- Google Sheets as a middle layer (fully manual). Export a CSV from Ads Manager, paste it into a Sheet, and connect Looker Studio to the Sheet. Zero connector cost, but you re-export every reporting period by hand.
Whichever you pick, the connection becomes a Looker Studio data source. Once authorized, you choose the ad account and the fields, and Looker Studio caches the result for the report.
Set up and clone a free template
You do not need to design from scratch. The standard flow:
- Open a shared template from the Looker Studio template gallery or a public template link, then click Use my own data (or Make a copy).
- Replace the sample data source with your own Meta connection from the step above. Looker Studio prompts you to map the template’s data source to yours.
- Set the report-level date range control so every chart obeys one global filter.
- Rename and reorganize the pages to match how you report: an overview page, a campaign page, and a breakdowns page is plenty.
If you want to recreate a clean free template yourself, structure it as three pages:
- Overview: scorecards for spend, results, cost per result, and ROAS or pipeline value, plus a spend trend line.
- Campaigns: a table sorted by spend with the same efficiency columns, so the biggest line items sit at the top.
- Breakdowns: age and gender, plus placement, as bar charts to spot where budget is and is not working.
That mirrors what a focused Meta Ads report should include, without the noise of every field Meta returns.
Which KPIs to put on the dashboard
Lead with the metrics tied to the goal, not every column the connector offers. The core set:
- Spend and results. What you spent and what you got, side by side.
- Reach, impressions, and frequency. Frequency in particular flags fatigue when it climbs while results soften.
- CPC, CPM, and CTR. The efficiency layer. CTR = clicks / impressions; CPC = spend / clicks; CPM = spend / impressions times 1000.
- The outcome metric. ROAS = conversion value / spend for e-commerce, or cost per lead = spend / leads for lead gen.
Add a calculated field in Looker Studio for anything the connector does not return directly. For example, cost per lead is spend / leads as a custom metric. For a fuller list and what each one means, the 17 Meta Ads KPIs to track is the reference.
A note on judging “good”: there is no universal benchmark. A CTR or ROAS is good when it beats your prior period and clears your margin. Build a period-over-period comparison into the date control and read the trend, not an internet average. Break-even ROAS = 1 / profit margin is the line that actually matters for sales.
Where the manual refresh breaks down
Looker Studio is genuinely capable for one or two ad accounts and a calm reporting cadence. The friction shows up as you scale:
- One data source per ad account. Reporting on ten accounts often means ten connectors to authorize, configure, and keep on the same API version. A connector that goes stale silently leaves a chart blank.
- Connector cost climbs per source. The free tiers cap out, and paid connectors bill per account, so a free dashboard turns into a recurring line item once you have a real roster.
- CSV exports are a recurring chore. The Sheets route means re-exporting from Ads Manager every week or month, and a missed export means a stale board nobody trusts.
- Numbers drift from Ads Manager. Date range, timezone, and attribution-window mismatches make Looker Studio disagree with the platform, and the iOS and ATT changes cause Meta to undercount some conversions no matter the tool. When that happens, the Ads Manager numbers not matching reports guide covers the usual causes.
- Lead exports have a clock. If you pull Instant Form leads, remember Meta only lets you download them directly from the Page for a limited window, about 90 days, after which they must come through the API or a connected tool.
None of this makes Looker Studio wrong. It makes it a build-and-maintain choice rather than a plug-in-and-go one.
Where DashOps fits
DashOps is the plug-in-and-go alternative when the Looker Studio upkeep outweighs the flexibility. It connects your Meta ad accounts and reads every KPI across all of them in one dashboard, with period-over-period comparison, demographic and placement breakdowns, and PDF, Excel, and CSV exports built in, so there is no connector to babysit and no CSV to re-import. For agencies and freelancers, white-label client reporting and scheduled email digests replace the manual share step. See what each plan includes on the pricing page, and the help center walks through connecting an account.
The practical takeaway: a Looker Studio template is a great way to start reporting on Facebook Ads for free, as long as you treat the connector and the refresh as the real cost.
Frequently asked questions
Is Looker Studio free to use for Facebook Ads reporting?
Why do the numbers in my Looker Studio dashboard not match Facebook Ads Manager?
Can I report on multiple Meta ad accounts in one Looker Studio dashboard?
See it in your own dashboard
DashOps brings Meta Ads reporting, campaign management, and white-label client portals into one place. Pick the plan that fits how you run ads.