What Should a Meta Ads Report Include? The Essential Sections Checklist
A complete Meta Ads report has a predictable shape: a KPI summary tied to the goal, a trend comparison, breakdowns that explain the numbers, a campaign view, pacing, and a short read on what to do next. Knowing what to include in a Meta Ads report keeps you from dumping every metric Meta returns and burying the one answer the reader wants: did the money work, and what changed. Below is a section-by-section checklist you can use for any account, whether you run lead gen or e-commerce. Each section maps to a panel that is already pre-built in DashOps, so you are organizing data rather than rebuilding it every period.
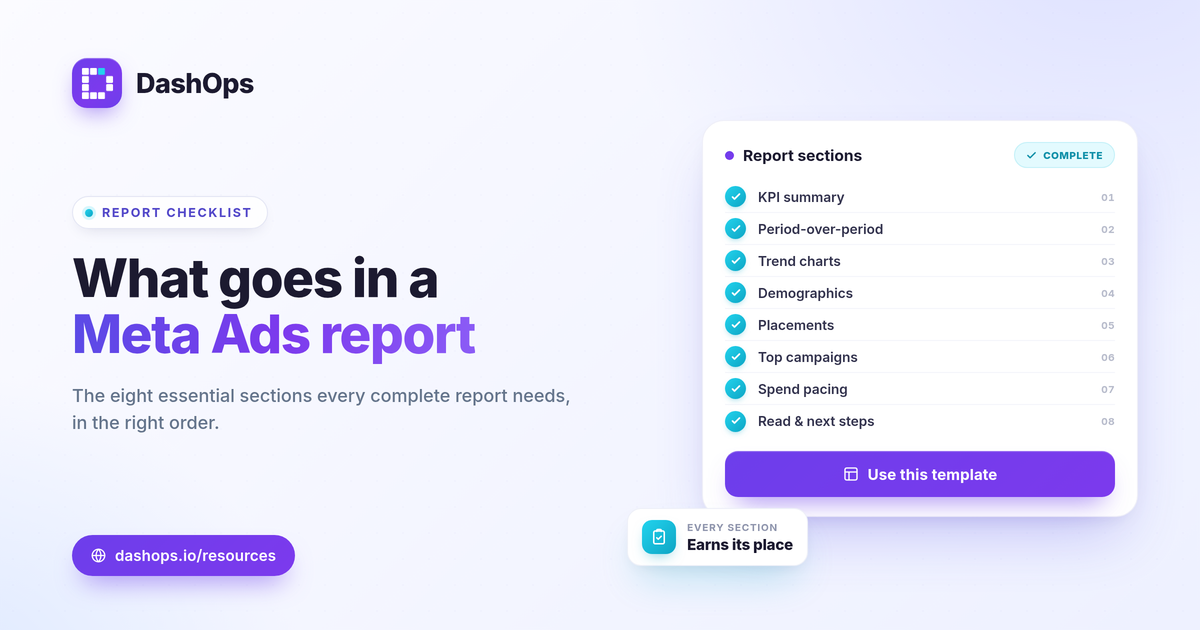
Section 1: The KPI summary up top
Open with the headline numbers tied to the objective. This is the part most readers actually absorb, so it goes first and stays short.
- Spend and results. What you spent and what it produced, side by side. Results means purchases for e-commerce, leads for lead gen.
- Efficiency. Cost per result: cost per lead (spend / leads) or cost per purchase. This is the number that tells you whether each outcome is getting cheaper or more expensive.
- Return. ROAS for sales (conversion value / spend), or pipeline and lead value for lead gen.
- Core delivery metrics. Impressions, reach, clicks, CPC (spend / clicks), CPM (spend / impressions times 1000), and CTR (clicks / impressions).
DashOps surfaces 17 plus Meta KPIs here and adapts the headline set to whether the account is lead gen or e-commerce, so a lead-gen report leads with cost per lead instead of ROAS. For a fuller list of which metrics belong in the summary, see the Meta Ads KPIs to track.
Section 2: The period-over-period comparison
A total with no context is half a report. Every KPI in the summary should sit next to the same metric from the prior period so the reader can see direction, not just magnitude.
- Show the delta. Last month versus this month, or last week versus this week, for spend, results, cost per result, and ROAS.
- Flag what moved. A rising cost per lead or a falling CTR is the story. Make it visible rather than leaving the reader to do the subtraction.
- Match the cadence to the audience. Monthly suits most stakeholders; weekly suits active optimization. If you are unsure which to send, weekly versus monthly Meta Ads reports walks through the tradeoff.
This comparison is built into the DashOps dashboard, so every KPI already carries its prior-period change without manual exporting.
Section 3: Trend charts over time
Numbers tell you where you are; trend lines tell you how you got there. Include a chart for at least spend and your primary result so the reader can see whether a change was a steady drift or a single spike.
- Spend over time to catch pacing problems early.
- Cost per result over time to spot creep before it eats the budget.
- Frequency over time if you suspect fatigue. A climbing frequency alongside a softening CTR is the classic fatigue signal, and both are real KPIs you can chart.
Section 4: Demographic breakdowns
A summary hides who the spend reached. Demographic breakdowns answer that question and often surface the easiest wins.
- Age and gender splits showing spend, results, and cost per result per segment.
- Read it against your goal. A segment with a low cost per result is a candidate to scale; one running expensive is a candidate to trim or exclude.
DashOps includes age and gender breakdowns as standard panels, so this section is a read rather than a build.
Section 5: Placement breakdowns
Where ads ran matters as much as who saw them. A placement breakdown separates Feed, Stories, Reels, and the rest so you can see which surfaces earn their spend.
- Spend and cost per result by placement to find the efficient and the wasteful.
- Use it to inform structure, not just to report. If one placement consistently underperforms for your goal, that is an action item, not a footnote.
Section 6: Top campaigns
Stakeholders want to know which campaigns drove the result. A ranked campaign view gives the report a concrete, named layer beneath the account totals.
- Top campaigns by spend and by result, with cost per result alongside.
- Keep it to the meaningful few. A top-five or top-ten list reads better than a full dump of every campaign in the account.
Section 7: Spend pacing
Pacing closes the loop on budget. It shows whether you are on track to spend the planned amount by period end, which prevents both underspending and runaway overspend.
- Spent so far versus planned, with a projection for where the period lands.
- Call out the gap if pacing is off, because that is a decision the reader can act on immediately.
Section 8: A short read and next steps
End with interpretation, not raw data. Two or three sentences naming what changed, why it likely changed, and what you plan to do next turns a data export into a report someone can act on. For lead-gen accounts, this is also where you note lead quality context that the platform numbers alone do not show.
A note on the numbers matching
If your report figures look different from Meta Ads Manager, that is usually expected: date ranges, attribution windows, and iOS privacy changes all cause variation, and the latter tends to undercount conversions. Reporting Meta-native numbers consistently, period over period, matters more than chasing an exact match. If the gap is confusing a client, why Ads Manager numbers do not match reports explains the common causes.
How DashOps assembles the checklist for you
Every section above is a pre-built panel in DashOps, pulled live from your connected Meta ad accounts with period-over-period comparison already applied. You can export the whole thing to PDF, Excel, or CSV, schedule it as an email digest, or send a white-label client report on Growth and Enterprise plans. See what each plan includes on the pricing page, and the help center covers connecting accounts and setting up reports. If you compare a dashboard to building reports by hand, Ads Manager versus a reporting dashboard lays out the difference.
A complete Meta Ads report is not the one with the most metrics; it is the one where every section answers a question the reader was already asking.
Frequently asked questions
What should a Meta Ads report include at a minimum?
What is the right order for the sections in a Facebook Ads report?
Should a lead-gen report include different sections than an e-commerce report?
See it in your own dashboard
DashOps brings Meta Ads reporting, campaign management, and white-label client portals into one place. Pick the plan that fits how you run ads.