How to Build a Facebook Ads Country and Region Breakdown Report
What a country and region breakdown report actually answers
A Facebook Ads country breakdown report answers one question: which locations make money and which ones drain budget. It takes your Meta Ads performance and splits it by country and region, so spend, cost per result, and country level ROAS sit side by side for every market you reach. The payoff is concrete. You find the geographies carrying your results, spot the ones quietly burning budget, and reallocate without guessing. Below is how to build a geographic ad performance report that holds up, whether you sell e-commerce products across borders or run lead gen in a handful of regions, and how to bring the numbers that surround it into one place so the comparison is easy to repeat.
Start with the locations that matter to your goal
Meta can break performance down by country and by region inside a country, but you do not need every location at once. Begin at the altitude that matches how you actually run ads.
- Country level first. If you advertise across more than one country, group performance by country in Ads Manager. This is the cleanest view of where your money works.
- Region level when it counts. Local services, real estate, and area-based businesses benefit from a region breakdown view: states, provinces, or metro areas inside one country.
- Tie it to the objective. A region breakdown is only useful if it maps to where you can deliver, ship, or take leads.
The mistake is opening the breakdown with twenty locations and no order. Sort by spend so the markets taking the most budget sit at the top, then read across.
The columns a geographic report needs
A location performance report is only as good as the metrics next to each country. Pull the same core columns for every location so comparisons are honest.
- Spend. What each country or region cost you.
- Results. Purchases for e-commerce, leads for lead gen. The thing you are paying for.
- Cost per result. Cost per purchase or cost per lead, calculated as spend divided by results.
- Return. ROAS for sales, where ROAS = conversion value / spend. For lead gen, track cost per lead, where cost per lead = spend / leads.
- Reach or impressions. Useful context, but never the headline. Volume without results is not performance.
DashOps adapts its KPIs to your account type, so a lead-gen account surfaces cost per lead and a store surfaces ROAS and cost per purchase across the same dashboard. If you want a refresher on which numbers belong in any Meta report, the post on Meta Ads KPIs to track covers the full set.
Read the report to find profitable markets
With locations sorted by spend and the right columns in place, the story usually appears fast. Read it in this order.
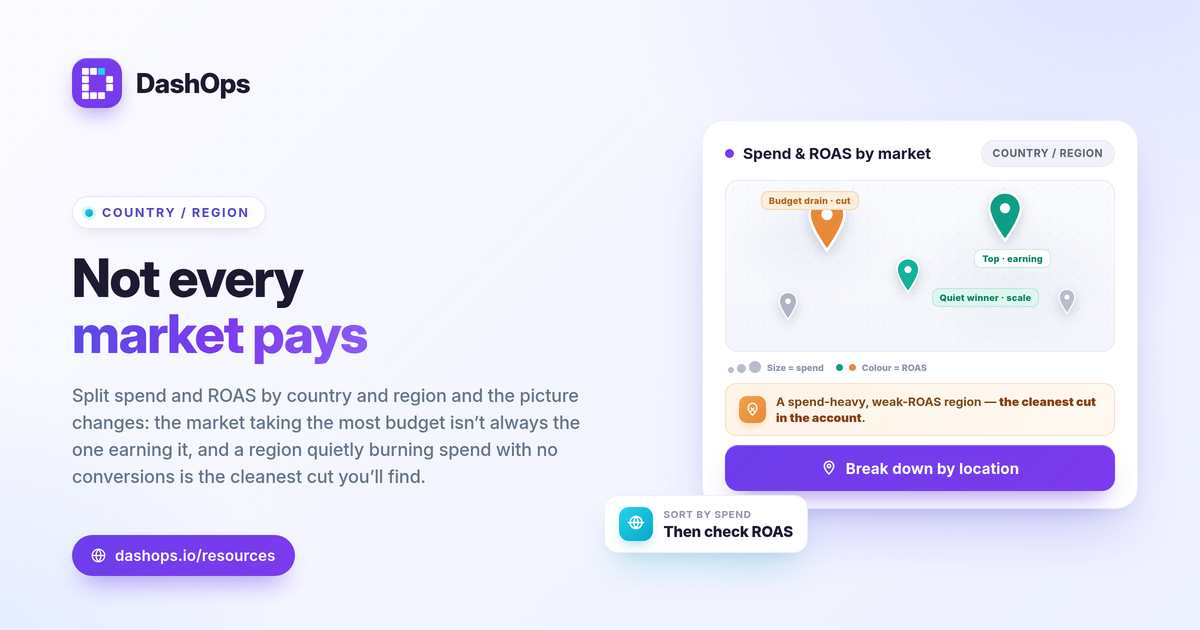
- Top spenders. The countries taking the largest share of budget. Are they earning it? Check ROAS or cost per lead, not just result count.
- Quiet winners. Locations with low spend but strong efficiency. These are your candidates to scale.
- Budget drains. Countries or regions absorbing real spend while returning weak ROAS or expensive leads. This is where country level ROAS reporting pays for itself.
A country is not “good” or “bad” against a universal number. Judge each location against your own margin, your target cost per result, and what it did last period. The same ROAS figure can be excellent at one margin and unprofitable at another, so a tidy break-even reference helps: break-even ROAS = 1 / profit margin. For framing that tradeoff cleanly, the explainer on ROAS vs CPL vs CPA is a useful companion.
Cut wasted geo spend with evidence, not instinct
Finding a weak location is step one. Acting on it correctly is step two.
- Confirm the pattern across periods. One short window can mislead. A market that looks weak this week might be normal variance. Use period-over-period comparison to see whether the underperformance is consistent before you cut.
- Separate weak from new. A country you just expanded into needs time before its cost per result settles. Do not cut a market that has not had a fair run.
- Decide the lever. You can reduce budget, tighten the targeting so the location no longer serves, or exclude it entirely. Match the action to how confident the data makes you.
- Re-check after the change. A reallocation is a hypothesis. Watch the next period to confirm the freed budget actually improved overall efficiency.
This is the same discipline behind any spot wasted Facebook ad spend workflow: let the breakdown point, then verify before you move money.
Read geographic numbers with attribution in mind
Two caveats keep a country breakdown honest, and both are about counting, not targeting.
- iOS undercounting. Since Apple’s tracking changes, Meta undercounts conversions for users who opted out of tracking. The effect is not evenly distributed across countries, so a market with heavy iOS usage can look weaker on Meta’s reported numbers than it truly is. Treat the geographic ROAS as directional and reconcile against your own sales or CRM where the stakes are high.
- Meta-native numbers only. A country breakdown reports what Meta attributes. It is not a blended or server-side attribution model. Use it to compare locations against each other on a consistent basis, which is exactly what it is good for.
If reported numbers and your back-office totals diverge, that gap is expected, not a bug. Keeping the breakdown for relative comparison and your store or CRM for absolute truth is the right split.
Bring the surrounding numbers into one dashboard
You build the country and region breakdown itself in Ads Manager, where the geographic view lives. The friction is everything around it: the breakdown sits apart from your main reporting, and you rebuild the context by hand every period, which is why most people check geography rarely instead of routinely. The deeper comparison of Ads Manager vs a reporting dashboard walks through where the manual approach costs you time.
DashOps reads every KPI across your Meta ad accounts in one dashboard, with period-over-period comparison and trend charts built in, plus demographic and placement breakdowns, so the spend, ROAS, and cost-per-result context you weigh each market against is always a click away rather than a rebuild. When you take a finding to clients, white-label PDF reports and public read-only share links present those numbers under your own brand, covered in the guide to white-label client reporting. See what each plan includes on the pricing page, and the help center covers connecting your accounts and setup.
The practical takeaway: sort your locations by spend, judge each against your own margin and last period, and confirm a pattern holds before you move budget.
Frequently asked questions
Does Meta show ROAS broken down by country?
What is the difference between a country breakdown and a region breakdown?
How do I find wasted ad spend by location?
See it in your own dashboard
DashOps brings Meta Ads reporting, campaign management, and white-label client portals into one place. Pick the plan that fits how you run ads.