E-commerce Facebook Ads Report Template: A ROAS and Purchase Tracker for Online Stores
An ecommerce Facebook Ads report template answers one question for an online store: did the ad spend turn into profitable sales, and what changed since last period. The strongest version leads with purchases, purchase value, ROAS, and cost per purchase, shows each against the prior period, then adds just enough breakdown to explain the numbers. This guide gives you a purchase and ROAS focused layout you can copy into a spreadsheet or slide, plus an adaptive dashboard alternative that fills the same fields automatically. Use it as an ecommerce Meta Ads report template you reuse every week or month, not a one-off export you rebuild from scratch each time.
Start with the revenue scoreboard
Open with the metrics tied to selling product, not every column Meta returns. For an online store, five numbers carry the report.
- Spend. What you put into Meta Ads for the period.
- Purchases. The number of orders attributed to the ads.
- Purchase value. The revenue Meta attributes to those orders.
- ROAS. Return on ad spend, calculated as conversion value divided by spend.
- Cost per purchase. Spend divided by purchases, so you can see what each order cost to acquire.
Put these in a single row at the top with the prior period beside each one. A reader should see the scoreboard before any chart or breakdown. ROAS without spend context is misleading: a strong return on a tiny budget is a different story than the same return at scale, so the two always travel together.
Show the trend, not just the total
A single ROAS figure hides whether things are improving or sliding. A period-over-period comparison answers the question a store owner actually has: did this month beat last month. Add a small change column or a short trend line for spend, purchase value, and ROAS so the direction is obvious at a glance.
Watch the relationship between the numbers, not each one alone. Rising spend with flat purchase value means ROAS is falling. Steady ROAS with growing purchase value usually means the account is scaling cleanly. The template should make those patterns visible without the reader doing math in their head.
Add average order value and break-even ROAS
Two numbers turn a reporting template into a decision tool for ecommerce.
- Average order value (AOV). Purchase value divided by purchases. A rising AOV can lift ROAS even when order count holds steady, and a falling AOV explains a softer return that volume alone would not.
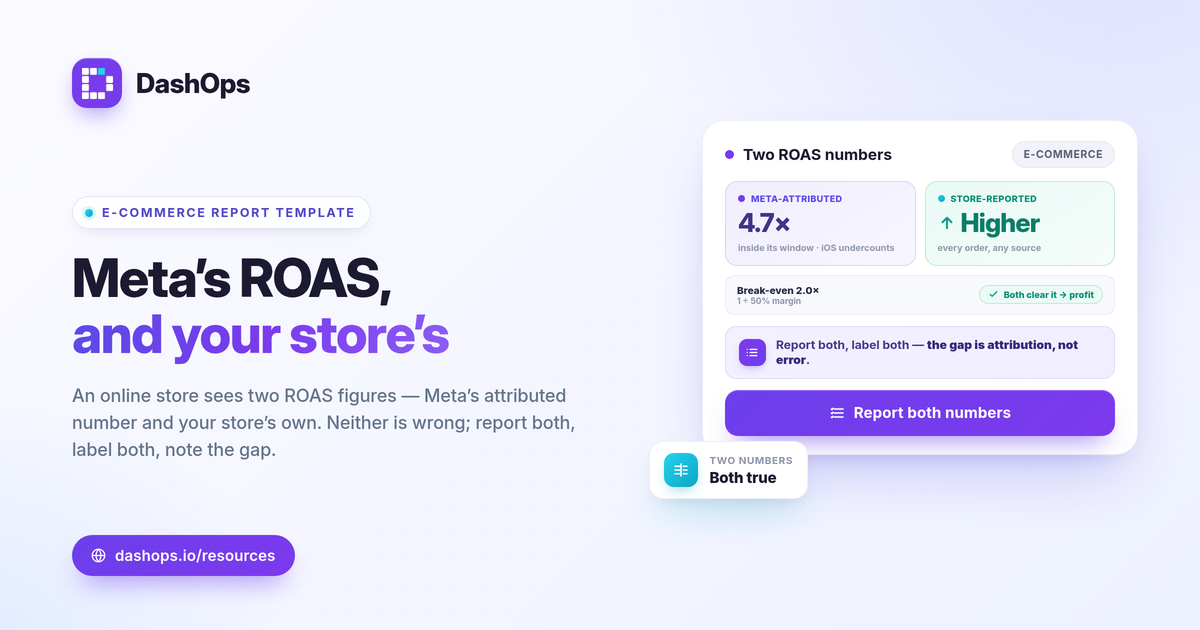
- Break-even ROAS. The point where ad-driven revenue covers the cost of the product and the ad. It is one divided by your profit margin. As a worked example, if your margin is 50 percent, break-even ROAS is 2.0, so any ROAS above that is profit and anything below is a loss.
Including break-even ROAS reframes the whole report. Instead of asking whether a number looks high, the reader compares actual ROAS to the line where the store starts making money. That is far more useful than chasing a universal benchmark, since “good” depends entirely on your margins and goals. For more on this judgment, see what is a good ROAS for ecommerce Facebook Ads.
The ecommerce Facebook Ads report template, section by section
Here is the full layout. Each block is a section in your spreadsheet, slide, or dashboard.
| Section | What to show |
|---|---|
| Revenue scoreboard | Spend, purchases, purchase value, ROAS, cost per purchase, each vs prior period |
| Order economics | AOV and break-even ROAS, with actual ROAS marked against break-even |
| Trend | Spend, purchase value, and ROAS over time |
| Top campaigns | Best and worst campaigns by ROAS and by spend |
| Spend pacing | Budget delivered so far vs where it should be |
| Breakdowns | Age and gender, plus placement, by ROAS and cost per purchase |
| Notes | One short paragraph: what changed and what you are doing about it |
The breakdowns are where wasted spend hides. A placement that drains budget at a weak ROAS, or an age and gender segment that buys far below the account average, is the kind of thing a top-line number never reveals. For the metrics behind each block, Meta Ads KPIs to track is a useful companion.
Report Meta ROAS and store ROAS, and label both
Online stores almost always see two different ROAS figures: the one in Meta Ads and the one in their store platform. Meta only counts conversions it can attribute inside its attribution window, and since the iOS and ATT changes it tends to undercount, which leaves attributed purchases lower than your real order count. Your store platform counts every order regardless of source.
Neither number is wrong; they measure different things. The honest move is to show both, label them clearly as Meta-attributed and store-reported, and note the gap rather than quietly picking the flattering one. A reader who understands why the two differ trusts the report more, not less. If you want the deeper version of this, reconcile Meta conversions with real sales walks through it.
Spreadsheet template or a dashboard that fills it
A copy-and-paste spreadsheet template is free and flexible, and it is the right starting point if you report on one store occasionally. The cost shows up over time: you export from Ads Manager, paste columns, fix formulas, recalculate the prior period, and rebuild it every cycle. The numbers are only as fresh as your last manual pull. The trade-offs between a static export and a live tool are covered in Facebook Ads Manager vs a reporting dashboard.
A dashboard fills the same template automatically. It reads spend, purchases, purchase value, ROAS, and cost per purchase straight from your connected ad accounts, applies the period-over-period comparison for you, and keeps the breakdowns current without a re-export.
DashOps does exactly this for online stores: an adaptive dashboard that recognises an ecommerce account and surfaces purchase and ROAS KPIs, with demographic and placement breakdowns, top campaigns, and spend pacing built in. You can export the result to PDF, Excel, or CSV, or send a white-label client report instead of a raw spreadsheet, which white-label client reporting explains further. See what each plan includes on the pricing page, and the help center covers connecting an account and scheduling reports.
The takeaway: build your ecommerce report around purchases, ROAS, and break-even, compare it to last period, and report Meta and store numbers side by side so the result holds up to scrutiny.
Frequently asked questions
What should an ecommerce Facebook Ads report include?
Should I report Meta ROAS or my store's ROAS?
How often should I send an ecommerce ad report?
See it in your own dashboard
DashOps brings Meta Ads reporting, campaign management, and white-label client portals into one place. Pick the plan that fits how you run ads.