How to Build a Cost Per Lead Dashboard for Facebook Ads in Minutes
A cost per lead dashboard for Facebook ads is a single live view that shows what each Meta lead actually costs, broken down by campaign and ad account, with the trend over time. The fastest way to build one is to connect your Meta ad accounts to a reporting tool that reads the leads and spend Meta already records, then let it compute CPL for you. Cost per lead is simple math, spend divided by leads, but doing it by hand across campaigns and accounts is where the time goes. This guide shows how to set up a CPL dashboard in minutes so the number is always current, not something you rebuild every Monday.
What a cost per lead dashboard needs to show
Before you build anything, get clear on what the dashboard answers. A good CPL dashboard tells you what a lead costs, where it is rising or falling, and which campaigns drive it.
- Cost per lead. The headline Meta CPL metric, calculated as spend divided by leads, shown per campaign and per ad account.
- Spend and lead volume. The two inputs behind CPL, side by side, so a change in cost has context.
- Period-over-period change. This week against last week, or this month against last, so you see direction, not just a snapshot.
- Top campaigns. Which campaigns produce the cheapest and the most expensive leads.
If you track those four things, you have a working CPL dashboard. Everything else is supporting detail.
Step 1: Connect your Meta ad accounts
Cost per lead tracking starts with the raw data, and the cleanest source is Meta itself. Connect each Meta ad account that runs lead campaigns. Once connected, the spend and lead numbers flow in automatically, so you are reporting on Meta-native figures rather than retyping them into a spreadsheet.
If you run lead gen for more than one brand or client, connecting several accounts in one place is the whole point. You get a CPL figure for each account and a combined view, without logging in and out of Ads Manager. The post on managing multiple Meta ad accounts covers how that consolidated setup works.
Step 2: Pick the right lead metric
Facebook ads lead reporting has more than one definition of a lead, so decide which one your dashboard uses before you trust the CPL number.
- Instant Form leads. People who submitted a Meta lead form. This is the most direct count for lead campaigns and the one most CPL dashboards use.
- Conversion leads. Off-platform leads tracked through the pixel or the Conversions API, for campaigns that send people to a landing page.
These can produce different lead counts and therefore different CPL figures. Keep them straight: pick the metric that matches how the campaign was built, and label it clearly. If you want the deeper breakdown of how lead gen KPIs differ from e-commerce ones, see lead gen vs e-commerce Meta KPIs.
Step 3: Set the comparison period
A single CPL number is almost meaningless on its own. Whether a given cost per lead is good or bad depends only on your own goal, your margin, and where the number was last period.
- Compare to your target. What you can pay per lead depends on what a lead is worth to your business. Set that ceiling first.
- Compare to the prior period. Period-over-period comparison shows whether CPL is climbing or falling, which is the real signal.
- Watch for drift. A slowly rising cost per lead often means audience fatigue. Demographic and placement breakdowns plus frequency as a KPI help you see why before the cost climbs further.
Resist the urge to judge your CPL against a universal benchmark. The right reference is your own numbers and your own economics, not a figure from someone else’s account.
Step 4: Break CPL down by campaign and segment
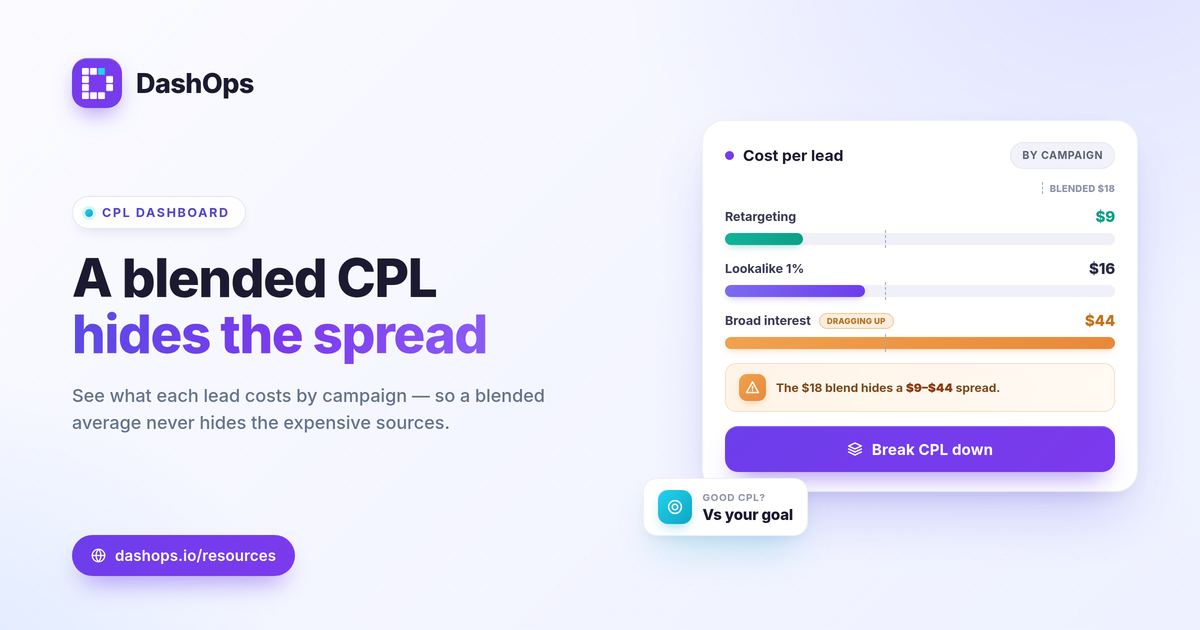
A blended cost per lead hides the campaigns dragging the average up. Break it apart so you can act.
- By campaign. Find the cheapest and most expensive lead sources, and shift budget accordingly.
- By age and gender. A demographic breakdown shows which segments convert at a workable cost and which burn spend.
- By placement. Comparing Feed, Stories, Reels, and other placements often surfaces wasted spend.
This is where a dashboard beats a static export. The breakdowns are already there, so you move from the headline CPL to the cause in a couple of clicks rather than rebuilding pivot tables.
Step 5: Make it live and shareable
The point of a dashboard, as opposed to a monthly spreadsheet, is that the number is always current. A live CPL dashboard updates as Meta reports new data, so you are never looking at a stale figure.
- Export when you need a file. PDF, Excel, or CSV for a record or an attachment.
- Schedule a digest. Email a recurring CPL summary so stakeholders get the number without asking.
- Share a link. A read-only link or a simplified client portal lets others see CPL without a login or edit access.
If you report to clients, a white-label view keeps it on your brand. The white-label client reporting post explains how that presentation layer works.
Dashboard vs Ads Manager for CPL
Ads Manager can show cost per lead, so why build a separate dashboard? The difference is consolidation and presentation.
| Need | Ads Manager | CPL dashboard |
|---|---|---|
| One account, quick check | Fine | Fine |
| Multiple ad accounts at once | Manual, account by account | Combined in one view |
| Period-over-period built in | Limited | Standard |
| Client-ready, branded output | No | Yes |
For a fuller side-by-side, the Facebook Ads Manager vs reporting dashboard comparison goes deeper. And if you want the wider list of metrics a lead dashboard should sit alongside, the Meta ads KPIs to track guide is a good companion.
A note on lead exports and retention
If you capture leads through Meta Instant Forms, remember the retention window. Meta only lets you download Instant Form leads directly from the Page for a limited time, about 90 days, after which the leads must be retrieved through the API or a connected tool. Pulling leads into a dashboard regularly, with CSV or Excel export, keeps a copy before that window closes.
DashOps reads spend and leads across every connected Meta ad account and calculates cost per lead for you, per campaign and combined, with period-over-period comparison and demographic and placement breakdowns in one dashboard. You can export to PDF, Excel, or CSV, schedule email digests, or send a white-label client report. See what each plan includes on the pricing page, and the help center walks through connecting an account.
The practical takeaway: connect your Meta accounts once, pick a consistent lead definition, and let the dashboard keep your cost per lead current so you are always reacting to today’s number, not last month’s.
Frequently asked questions
How is cost per lead calculated for Facebook ads?
Why does my Facebook cost per lead differ from my CRM?
Can one dashboard show cost per lead across multiple ad accounts?
See it in your own dashboard
DashOps brings Meta Ads reporting, campaign management, and white-label client portals into one place. Pick the plan that fits how you run ads.