Lead Gen vs E-commerce Meta KPIs: Which Metrics Your Dashboard Should Track
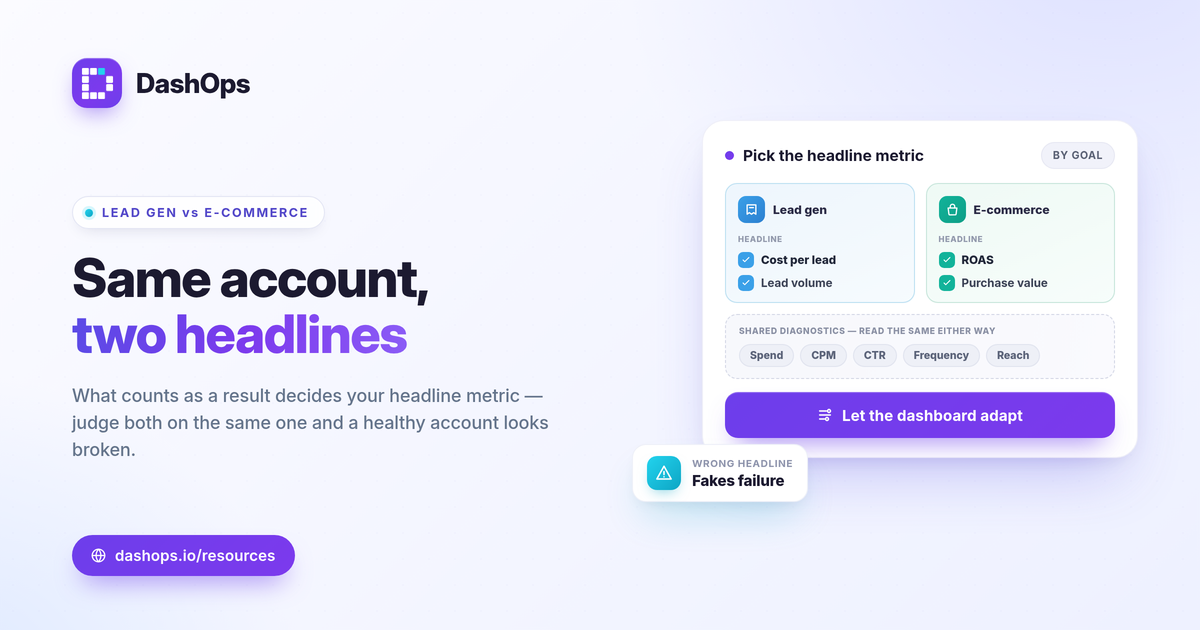
A lead-gen advertiser and an ecommerce store can run the exact same ad account interface and still need to watch completely different numbers. The lead gen vs ecommerce Meta KPIs question comes down to one thing: what counts as a result. Lead gen optimizes toward form submissions, so its core metrics are leads, cost per lead, and lead volume. Ecommerce optimizes toward sales, so its core metrics are purchases, purchase value, and ROAS. Both share spend, reach, CTR, and frequency as diagnostics, but the headline you judge success by is not the same. Tracking the wrong headline makes a healthy account look broken.
Why the same dashboard needs two different headline metrics
Meta returns dozens of columns for every account, but only a few answer the question your reader actually has. For a lead-gen business that question is “how many inquiries did we get, and what did each one cost.” For an ecommerce brand it is “how much revenue did the ads return on what we spent.”
If you put a lead-gen account next to a store and judge both on ROAS, the lead-gen account looks like it has no return at all, because Meta is not recording a purchase value. If you judge both on cost per lead, the store has no leads to count. The metrics are not better or worse, they answer different goals. This is the heart of the cost per lead vs ROAS distinction, and it is why a single fixed report layout rarely serves both.
The Facebook ads lead gen metrics that matter
For a lead-gen account, the dashboard should lead with the numbers tied to inquiries and their cost.
- Leads and cost per lead. How many form submissions you got and what each one cost. Cost per lead = spend / leads.
- Lead volume trend. Whether lead count this period beat the last, using period-over-period comparison. Volume often matters as much as unit cost.
- CTR and CPM as diagnostics. When cost per lead rises, these tell you whether the cause is weaker engagement (CTR falling) or a more expensive auction (CPM climbing).
- Frequency. A rising frequency on the same audience is an early sign of fatigue, which usually shows up as a slow climb in cost per lead before the lead count drops.
One caveat specific to lead gen: cost per lead says nothing about lead quality. A cheap lead that never closes is not a win. Pair the cost number with downstream context wherever you can, and capture the leads themselves while you can: Meta only lets you download Instant Form leads directly from the Page for a limited window, roughly 90 days, after which they have to come through the API or a connected tool. DashOps captures Meta Instant Forms leads and lets you export them to CSV or Excel, so the raw inquiries are not stranded. For more on the cost-versus-quality split, see cost per lead vs lead quality.
The ecommerce Meta KPIs that matter
For a store, the dashboard should lead with revenue and efficiency, not raw inquiry counts.
- Purchases and purchase value. How many orders the ads drove and the revenue Meta attributes to them.
- ROAS. The headline efficiency metric. ROAS = conversion value / spend. Judge it against your break-even ROAS, which is 1 / profit margin, not against a universal target.
- Cost per purchase. What it costs to acquire one order, which you can read from spend against purchases when margins are tight.
- CTR, CPM, and frequency. The same diagnostics as lead gen, read the same way when ROAS slips.
A note on the numbers themselves: Meta-attributed purchases come from in-platform conversion reporting, and iOS privacy changes cause Meta to undercount some conversions. DashOps reports the Meta-native figures as Meta returns them, so when your dashboard ROAS looks lower than your store’s own sales total, attribution gaps are often the reason rather than a tracking bug.
What both sides share
The split is real, but lead gen and ecommerce share a common diagnostic layer. These metrics do not change meaning by goal, they explain why your headline number moved.
| Metric | Lead gen reads it as | Ecommerce reads it as |
|---|---|---|
| Spend | Budget consumed for leads | Budget consumed for sales |
| CPM | Cost to reach the audience | Cost to reach the audience |
| CTR | Interest in the offer | Interest in the offer |
| Frequency | Fatigue warning | Fatigue warning |
| Demographic breakdown | Which age or gender converts cheapest | Which age or gender buys most |
| Placement breakdown | Where leads come cheapest | Where sales come cheapest |
Demographic (age and gender) and placement breakdowns are where a lot of wasted spend hides, for both goals. A placement that drives clicks but no leads, or impressions but no purchases, is the same problem wearing two labels. If ROAS, CPL, and CPA still feel blurry, ROAS vs CPL vs CPA explained walks through each.
How an adaptive KPI dashboard surfaces the right ones
Manually rebuilding a report layout per account is the slow path, and it is easy to leave a stale ROAS tile on a lead-gen client report where it just shows zeros. An adaptive KPI dashboard solves this by reading how each account is optimized and foregrounding the matching metrics.
- Lead-gen accounts get leads, cost per lead, and form volume up top.
- Ecommerce accounts get purchases, purchase value, and ROAS up top.
- Shared diagnostics like spend, CPM, CTR, reach, and frequency stay visible for both, so a moved result always has a visible cause.
This matters most when you manage a mix. An in-house team running both a sales catalog and a newsletter signup campaign, or a freelancer with one store client and one law-firm client, should not have to mentally translate metrics between accounts. The dashboard should already be showing the right ones. For broader context on which KPIs to watch overall, see Meta ads KPIs to track.
Putting it on a client report
The same adaptive logic should carry into what you send clients. A white-label report for a store should open on ROAS and purchase value, while one for a lead-gen client opens on cost per lead and lead volume. Sending an ecommerce-style report to a lead-gen client, full of empty ROAS fields, reads as careless even when the underlying account is healthy.
DashOps reads every Meta KPI across your ad accounts in one dashboard and adapts the headline metrics to each account’s goal, with period-over-period comparison, demographic and placement breakdowns, and white-label client reports built in. See what each plan includes on the pricing page, and the help center covers connecting accounts and configuring reports. For the client-facing side specifically, white-label client reporting goes deeper.
Pick your headline metric by the goal the account is optimized for, keep the shared diagnostics in view to explain it, and let the dashboard adapt the rest.
Frequently asked questions
What is the main difference between lead gen and ecommerce Meta KPIs?
Should ecommerce advertisers track cost per lead, or lead gen track ROAS?
How does an adaptive KPI dashboard know which metrics to show?
See it in your own dashboard
DashOps brings Meta Ads reporting, campaign management, and white-label client portals into one place. Pick the plan that fits how you run ads.