Weekly Facebook Ads Report Template: A Fast Format for Spend Pacing Check-Ins
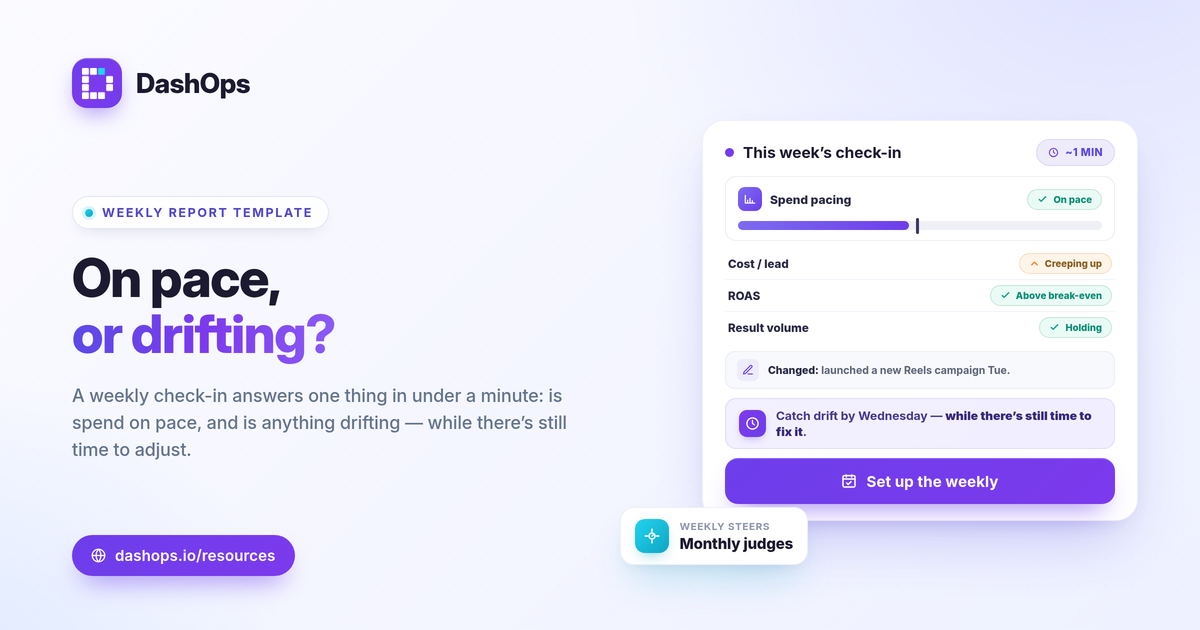
A weekly Facebook Ads report template should answer one question in under a minute: is spend on pace and is anything trending the wrong way. That is a different job from the monthly report, which judges whether the money worked. The weekly version is a check-in, so it stays short: budget pacing, your main result and its cost, return, and a week-over-week comparison. Below is a lightweight weekly Meta Ads report you can copy, the few numbers that belong on it, and how to schedule it so you stop rebuilding the same layout every Monday.
What a weekly report is for
A weekly ad reporting template is an early-warning tool, not a verdict. By Wednesday you want to know if budget is running ahead of schedule, if cost per result has crept up, or if volume has quietly fallen, while there is still time in the week to adjust. That framing keeps the report small. You are not explaining the whole account. You are checking pace and spotting drift.
Save the deep work for the monthly report. Demographic and placement breakdowns, frequency analysis, and top-campaign deep dives need more data than a single week reliably gives. For more on which numbers matter, see Meta ads KPIs to track, and weekly vs monthly Meta ads reports covers when each cadence earns its place.
The weekly Facebook Ads report template
Here is the full format. Five short sections, each answering one question.
1. Spend and pacing. The single most important line in a weekly report.
- Amount spent this week.
- Amount spent so far this period against the planned budget.
- A simple on-pace, behind, or ahead read. Even spend means dividing the period budget by the number of days and checking whether you are tracking to it.
2. Headline result and cost. What the spend bought.
- Your primary result count: purchases for e-commerce, leads for lead gen.
- Cost per result: cost per purchase or cost per lead, calculated as spend divided by results.
3. Return. Did the money work this week.
- ROAS for sales, using ROAS = conversion value / spend.
- Pipeline or lead value for lead gen, if you assign a value per lead.
4. Week-over-week change. The part that makes it a report and not a snapshot.
- Each metric above shown next to last week’s figure, with the direction of change.
- A period-over-period comparison is what turns numbers into a story a reader can act on.
5. One line on what changed. The human layer.
- A single sentence: a budget bump, a new campaign launched, a creative paused, a landing page edit. Context now saves a confused conversation later.
That is the whole Facebook Ads weekly performance report. If a section does not help you steer the account this week, leave it off.
How to read each line
The numbers only help if you know what counts as off-pace for you, so judge against your own targets rather than a universal benchmark.
- Pacing. Compare actual spend to where even pacing says you should be. Ahead of schedule is not automatically bad if results are strong, but it should be a deliberate choice, not a surprise.
- Cost per result. Read it against your own target and last week’s figure. A cost per lead that climbs two weeks running is a trend worth a closer look. What is good is whatever keeps you profitable at your margin.
- ROAS. For sales, compare against your break-even ROAS, which is 1 divided by your profit margin. Above break-even you are making money; below it you are not, regardless of how the number looks in isolation.
- Volume. Falling result counts at steady spend usually means rising costs. The weekly cadence is what catches that early.
Remember that iOS privacy changes cause Meta to undercount some conversions, so reported results can lag real sales. The weekly trend direction still tells you what you need to know, even if the absolute count runs a little low.
Why a template beats rebuilding it
The point of a fixed template is that the layout never changes, so your eye learns where each number lives and reading takes seconds. The work is in pulling the data, not in the design. That is also the part worth removing.
Exporting from Ads Manager and pasting into a sheet every week is slow and easy to get wrong, especially across multiple ad accounts. A reporting dashboard reads the numbers for you and keeps the same layout each week. Facebook Ads Manager vs a reporting dashboard walks through the trade-offs in more detail.
Schedule it instead of sending it by hand
A weekly report only works if it actually goes out every week. The way to guarantee that is to schedule it rather than rely on remembering.
- Scheduled email digest. Pick a day, set the recipients, and let the summary land in the inbox on its own. Good for clients and stakeholders who want a recurring update.
- Read-only share link. For people who prefer to check live numbers when they want, a public read-only link avoids sending anything at all.
- Pacing and spike alerts. If you mainly care about budget running away or cost jumping, an alert to Slack or Discord can flag it the moment it happens, between scheduled reports.
For agencies and freelancers sending the same weekly report to several clients, white-label client reporting lets each report carry your own branding instead of a tool’s logo.
This is the kind of recurring, low-variation work DashOps is built for. It reads every weekly KPI across your Meta ad accounts in one dashboard with period-over-period comparison built in, and you can schedule email digests, share read-only links, or send Slack and Discord alerts so the weekly report runs without you rebuilding it. See what each plan includes on the pricing page, and the help center covers connecting an account and setting up a schedule.
Keep the weekly report short, automate the delivery, and reserve your attention for the one line each week where something actually changed.
Frequently asked questions
What should a weekly Facebook Ads report include?
How is a weekly report different from a monthly one?
Should I send a weekly report or share a live dashboard link?
See it in your own dashboard
DashOps brings Meta Ads reporting, campaign management, and white-label client portals into one place. Pick the plan that fits how you run ads.