How to Report on Multiple Facebook Ad Accounts in One Dashboard
When you run more than a handful of Meta ad accounts, the real work is not the ads, it is the logging in and out. To report on multiple Facebook ad accounts in one dashboard, you connect each account once, map a shared set of KPIs, and read spend and results across all of them in a single view with period-over-period comparison. That turns a morning of switching profiles in Ads Manager into one screen. This guide walks through how to consolidate multi-account Meta ads reporting cleanly, what to standardize before you trust the totals, and how to keep client accounts separate when you need to.
Why one dashboard beats switching between accounts
Ads Manager is built to operate one account at a time. The profile switcher works, but it does not add anything up for you, and it makes a simple question slow: how much did we spend across everything this week, and did results move.
A consolidated ad account dashboard fixes three specific pains:
- No more re-logging. Every connected account sits in one place, so you read totals without hunting for the right profile.
- Comparable numbers. The same KPIs line up across accounts, so a high cost per result in one stands out instead of hiding in a separate tab.
- One trend, many accounts. Period-over-period comparison runs across the whole set, so you see direction at a glance rather than reconstructing it account by account.
If you are weighing the native tool against a dedicated reporting layer, the trade-offs are covered in Ads Manager vs a reporting dashboard.
Step 1: Connect each ad account once
Start by connecting every Meta ad account you are responsible for. Each one connects as its own source, identified by its ad account id, so spend and results stay attributable to the correct account even when you view everything together.
A few things to settle up front:
- Connect everything you report on, not just the active ones. Paused accounts still hold historical spend you may need for a trend.
- Confirm currency and time zone per account. These are set at the account level in Meta and they do not always match across a portfolio. Knowing them now saves a reconciliation headache later.
- Name accounts so you can scan them. A clear label beats a raw id when you are looking at ten rows.
DashOps lets you manage multiple Meta ad accounts in one place, so this connect step is a one-time setup rather than something you repeat every reporting cycle.
Step 2: Standardize the KPIs across accounts
Consolidation only helps if the columns mean the same thing in every row. Before you read totals, agree on a shared KPI set so a Facebook Ads multi-account report is comparing like with like.
Anchor on the metrics tied to the goal:
- Spend and results. What each account spent and what it returned, side by side.
- Efficiency. Cost per result, whether that is cost per lead or cost per purchase.
- Return. ROAS for sales accounts, pipeline or lead value for lead-gen accounts.
The underlying formulas are the same in every account, which is what makes them comparable: CTR = clicks / impressions, CPC = spend / clicks, CPM = spend / impressions times 1000, ROAS = conversion value / spend, and cost per lead = spend / leads. If some of your accounts sell and others collect leads, adaptive KPIs matter, because a single fixed column set will misrepresent one of them. For a fuller list of what to standardize on, see the Meta Ads KPIs to track.
Step 3: Align date ranges, time zones, and attribution
This is the step that makes totals trustworthy, and the one most people skip. Accounts in a portfolio rarely share the same settings, and small mismatches add up.
Check these before you compare anything:
- Date range. Use one range for the whole view. A month-to-date total mixed with a last-30-days total is not a real comparison.
- Time zone. Two accounts on different time zones will split spend across day boundaries differently. Match the reporting window.
- Currency. Mixed currencies cannot simply be summed. Decide whether you report per account or convert to one currency for the headline.
- Attribution and undercounting. iOS and ATT changes cause Meta to undercount some conversions, so on-platform numbers can read low. This affects every account, but unevenly depending on audience and platform mix.
When a consolidated total does not match the sum you remember from Ads Manager, the cause is almost always one of the above rather than a reporting error. If the numbers still feel off, why Ads Manager numbers and reports differ walks through the usual suspects.
Step 4: Read the consolidated view, then drill down
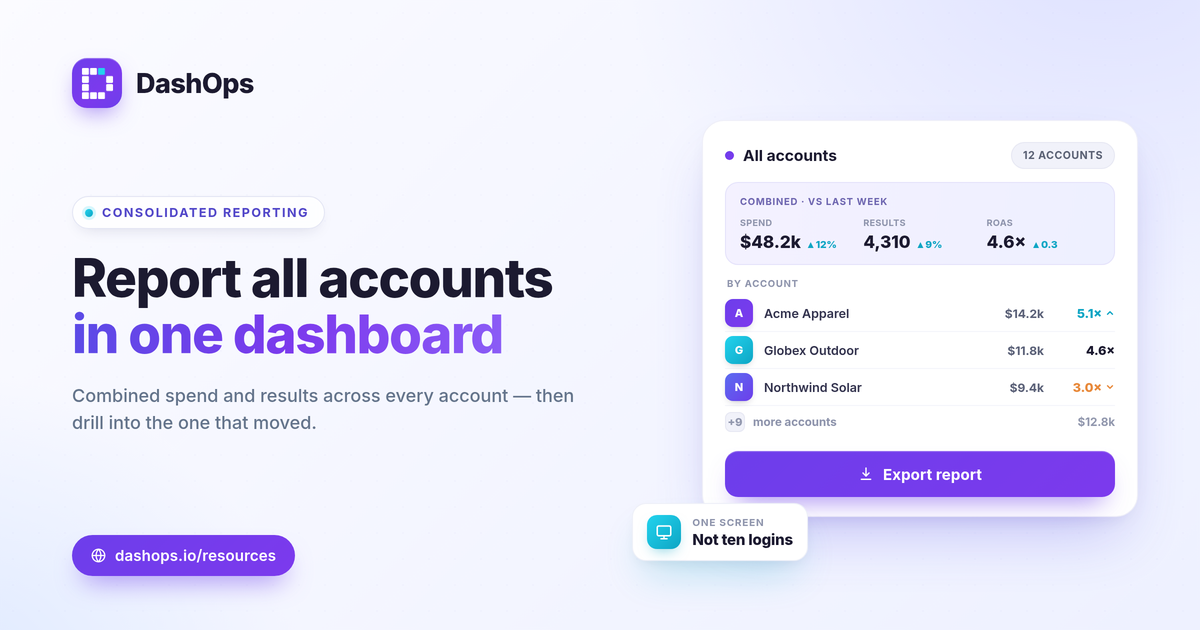
With accounts connected and KPIs aligned, the dashboard answers the portfolio question first: total spend, total results, and the period-over-period direction across everything. From there you drill into the accounts that moved.
A practical reading order:
- Start with the headline. Combined spend and results against the prior period.
- Find the outliers. Which account drove the change, up or down.
- Open that account. Use demographic, placement, and top-campaign breakdowns to see what shifted inside it. Rising frequency alongside a falling CTR over consecutive periods is a fatigue signal worth catching early.
This is the moment a consolidated dashboard earns its keep: you spot the one account that needs attention without reading all of them line by line.
Keeping client and internal accounts separate
Managing multiple ad accounts often means some belong to clients and some are your own. You want the full portfolio view for yourself, and a clean, single-account view for each client.
- Use roles. A Client user is read-only and sees only what you share, so a client never lands in another client’s numbers.
- Share narrowly. Public read-only share links and a simplified client portal let each client see their own account without an account in your platform.
- White-label the output. Scheduled email digests and white-label client reports go out under your brand. The mechanics of clean client-facing reporting are covered in white-label client reporting.
This separation is what lets one consolidated dashboard serve both jobs: your internal multi-account Meta ads reporting and each client’s individual report.
Bringing it together in DashOps
DashOps is built for exactly this: connect every Meta ad account, read 17 or more KPIs across all of them in one dashboard with period-over-period comparison, and export the result as a PDF, Excel, or CSV report or a scheduled digest. Per-account pricing and what each plan includes are on the pricing page, and the help center covers connecting accounts and setting up shared reports.
Standardize your KPIs and align your date ranges once, and reporting across many Facebook ad accounts becomes a single screen instead of a login marathon.
Frequently asked questions
Can I report on multiple Facebook ad accounts in one place?
How do I keep client ad accounts separate while still seeing the total?
Why do consolidated totals differ from the sum I see in Ads Manager?
See it in your own dashboard
DashOps brings Meta Ads reporting, campaign management, and white-label client portals into one place. Pick the plan that fits how you run ads.