Metabase and Power BI vs a Purpose-Built Meta Ads Dashboard: Is BI Overkill for Ad Reporting?
A general business intelligence tool like Power BI or Metabase can absolutely report on Meta Ads, but it is not built for it, so the question is whether the flexibility is worth the setup and maintenance. Power BI vs a Meta Ads dashboard really comes down to this: a BI tool gives you a blank canvas you have to wire up yourself, while a purpose-built dashboard ships the Meta connection, KPIs, breakdowns, and exports ready to use. If Meta is your main paid channel and you mostly need reliable reporting, the BI route is usually overkill. If you are blending many data sources into one custom model, the BI route earns its weight.
What you are actually comparing
These are two different categories of tool, not two versions of the same thing.
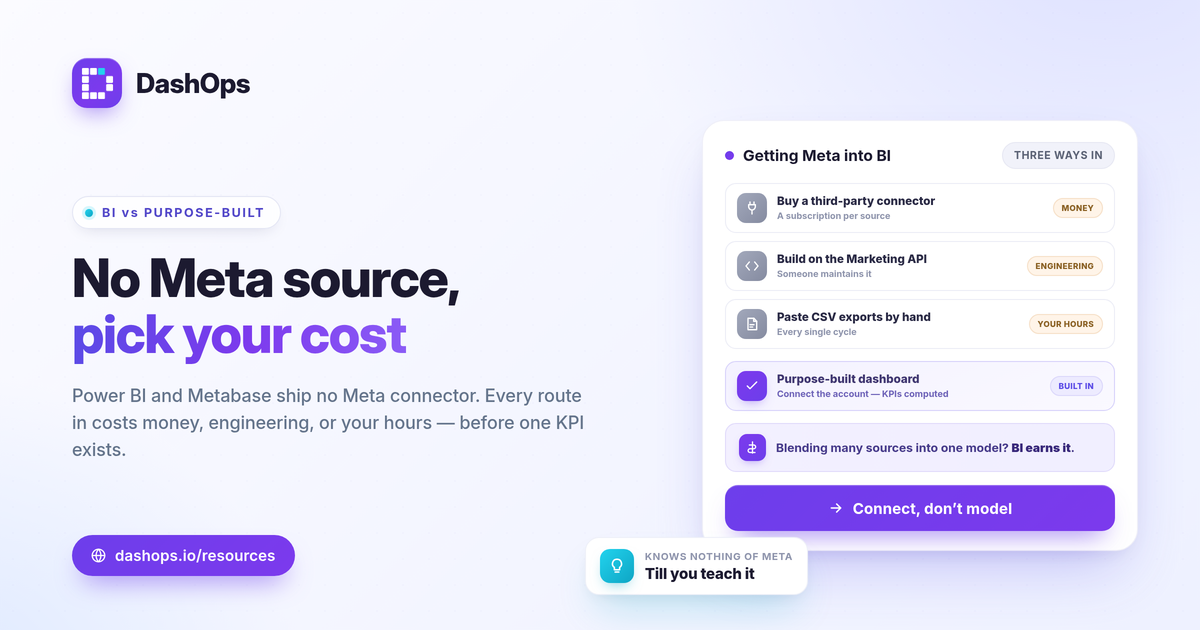
- A BI tool (Power BI, Metabase). A general engine for connecting data sources, modeling them, and building custom dashboards. It knows nothing about Meta until you teach it. Power BI Facebook Ads reporting and Metabase Facebook Ads reporting both start from an empty data model.
- A purpose-built Meta Ads dashboard. A tool that already understands the Meta graph: ad accounts, campaigns, the standard KPIs, and the breakdowns Meta returns. You connect an account and the reporting is there.
The BI tool wins on raw flexibility. The dedicated dashboard wins on time to a working report. Most of the decision sits between those two facts.
The setup gap
The biggest hidden cost of using a BI tool for Meta ads is getting the data in and keeping it current.
- No native Meta connector. Neither Power BI nor Metabase ships a built-in Meta Ads source. You either buy a third-party connector, build against the Meta Marketing API yourself, or import Ads Manager CSV exports by hand. Each path has a cost in money, engineering time, or manual labor.
- You model the metrics. Meta returns raw fields. Derived KPIs are formulas you build and maintain: CTR = clicks / impressions, CPC = spend / clicks, CPM = spend / impressions times 1000, ROAS = conversion value / spend, and cost per lead = spend / leads. Get one wrong and every report inherits the error.
- You build period-over-period yourself. Comparing this month to last is a query and a visual you design, not a toggle. The same goes for trend lines.
A purpose-built dashboard does this part for you. DashOps reads 17+ Meta KPIs with period-over-period comparison and trend charts already built, so the formulas above are computed for you rather than authored by you. If you want the full KPI list first, see the Meta ads KPIs worth tracking.
Breakdowns and the maintenance tail
Reporting is never finished. Meta changes fields, your account structure grows, and the people reading the report ask for more.
- Breakdowns. Demographic splits by age and gender, plus placement performance, are standard questions. In a BI tool you build each breakdown view and keep it working as the data shape shifts. A dedicated dashboard surfaces these as built-in reports.
- Multiple ad accounts. Add an account and a BI model needs new connections and merged queries. A purpose-built tool is designed to hold many accounts in one place, which is the whole point of managing multiple Meta ad accounts in one dashboard.
- Refreshes and gateways. A BI model needs scheduled refreshes, and on-premise data may need a gateway to stay current. That is infrastructure you own. A hosted dashboard keeps the data fresh as part of the product.
None of this is impossible in a BI tool. It is simply ongoing work that someone has to do, and that someone is usually you.
Where a BI tool genuinely wins
To be fair, the BI route is the right call in real situations.
- Many channels, one model. If you must blend Meta with search, email, organic, and offline sources into a single governed model, a BI tool is built for exactly that. A Meta-only dashboard is, by design, Meta only.
- Bespoke calculations. If you need a custom metric or a join no packaged tool will expose, the blank canvas is the feature.
- Existing BI investment. If your organization already runs on Power BI with a data team, adding Meta to that stack can be cheaper than introducing another tool.
The honest summary: BI tools trade setup and maintenance for unlimited flexibility. Decide which side of that trade your reporting actually needs.
Comparison at a glance
| Factor | BI tool (Power BI / Metabase) | Purpose-built Meta dashboard |
|---|---|---|
| Meta connection | DIY: connector, API, or CSV import | Built in: connect an account |
| KPIs and formulas | You model each metric | Computed for you |
| Period-over-period and trends | You build the queries | Included |
| Demographic and placement breakdowns | You build each view | Built-in reports |
| Multiple ad accounts | New connections and merges | Designed for many in one place |
| Client-ready exports | You design layouts | Native PDF, Excel, CSV |
| Cross-channel blending | Strong | Out of scope (Meta only) |
| Maintenance burden | Ongoing, owned by you | Handled by the product |
Check each vendor’s current pricing page for exact, up-to-date figures before you commit, since plans and connector costs change.
Reporting for clients and stakeholders
If the report leaves your screen, presentation matters as much as the numbers. A BI tool can produce polished output, but you build and maintain the templates, and white-label styling is your job. A purpose-built dashboard tends to package this: native PDF, Excel, and CSV exports, scheduled email digests, public read-only share links, and white-label client reports. If client delivery is your real need, see white-label client reporting and the broader question of Ads Manager versus a reporting dashboard.
Connecting this to DashOps
DashOps sits firmly on the purpose-built side: connect your Meta ad accounts and the KPIs, period-over-period comparison, demographic and placement breakdowns, and PDF, Excel, and CSV exports are ready without modeling them yourself. It will not replace a BI tool for cross-channel data warehousing, and it does not try to. For Meta reporting specifically, it removes the setup and maintenance tail. See what each plan includes on the pricing page, and the help center walks through connecting an account.
The practical takeaway: choose a BI tool when Meta is one input to a larger custom model, and choose a purpose-built dashboard when Meta reporting itself is the job.
Frequently asked questions
Can Power BI connect to Meta Ads directly?
Is a BI tool more flexible than a Meta ads dashboard?
When does a BI tool make more sense than a Meta dashboard?
See it in your own dashboard
DashOps brings Meta Ads reporting, campaign management, and white-label client portals into one place. Pick the plan that fits how you run ads.