Meta Ads Report Template for Excel: Build a Reusable Spend and ROAS Tracker
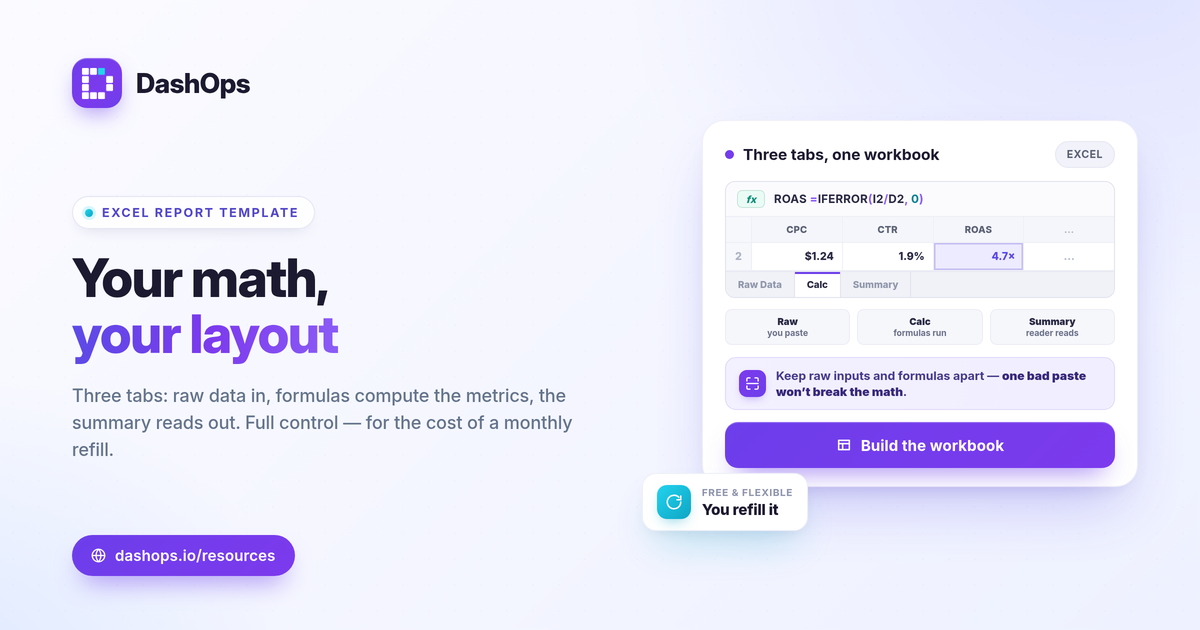
A Meta Ads report template in Excel is worth building once when you want full control over the layout and the math, and you are fine pulling fresh numbers from Ads Manager each period. The reusable version has three parts: a raw data tab where you paste exported numbers, a calculations layer that turns spend, impressions and clicks into CPC, CPM, CTR and ROAS, and a summary tab that shows the period-over-period story at a glance. Below is the step-by-step build, the exact formulas to drop in, and a note on where a native Excel export removes the monthly rebuild entirely.
Set up the raw data tab first
Keep everything Meta gives you on one tab, untouched by formulas. This is the foundation of any Facebook Ads Excel template, because if your raw inputs and your math live in the same cells, one bad paste breaks the whole sheet.
Create a tab named Raw Data with one row per campaign per period and these columns:
- Period (for example, the month or week start date)
- Ad account (use the account id, such as act_DEMO_001, if you run more than one)
- Campaign name
- Spend
- Impressions
- Reach
- Link clicks
- Result (purchases for e-commerce, leads for lead gen)
- Conversion value (revenue, for ROAS; leave blank for lead gen)
Export these from Ads Manager as a CSV or Excel file and paste them straight into this tab each period. Resist the urge to type calculated metrics like CTR here. Pull only the base numbers and let the next layer do the math.
Add the calculations layer
Now build the columns that turn raw inputs into the metrics people actually read. In a new set of columns (or a second tab that references Raw Data), add these formulas. Assume spend is in column D, impressions in E, reach in F, clicks in G, result in H, and conversion value in I, starting at row 2.
- CPC = spend / clicks:
=IFERROR(D2/G2,0) - CPM = spend / impressions times 1000:
=IFERROR(D2/E2*1000,0) - CTR = clicks / impressions:
=IFERROR(G2/E2,0)(format as a percentage) - Cost per result = spend / result:
=IFERROR(D2/H2,0) - ROAS = conversion value / spend:
=IFERROR(I2/D2,0) - Frequency = impressions / reach:
=IFERROR(E2/F2,0)
Wrap every division in IFERROR so blank or zero rows do not throw a divide-by-zero error. For a lead-gen Meta Ads spreadsheet report, your headline cost metric is cost per lead, which is the same as cost per result above: spend divided by leads. For e-commerce, ROAS and cost per purchase carry the report. If you are unsure which efficiency metric to lead with, ROAS vs CPL vs CPA explained breaks down when each one applies.
Build the summary tab
The raw and calculation tabs are for you. The summary tab is for whoever reads the report, and it should answer one question: did the money work, and what changed.
- Headline block. Total spend, total results, and the blended efficiency metric (ROAS or cost per lead) for the whole period. Use SUM across your calculation columns and recompute the ratios at the total level rather than averaging the per-campaign ratios, which distorts the number.
- Period-over-period comparison. Place this period next to last period in adjacent columns, with a third column for the change. A simple
=(thisperiod-lastperiod)/lastperiodgives you the percentage move. This comparison is the part clients and stakeholders care about most, because a single total hides whether things are improving. - Top campaigns. Sort your campaigns by spend or by result and show the top five. This keeps the summary readable instead of dumping forty rows.
Use conditional formatting to color the change column green and red so the direction reads in a glance. Keep the headline numbers tied to the goal, not every field Meta returns. Picking the right ones is its own decision, and Meta Ads KPIs to track covers which metrics earn a place in the report.
Make it genuinely reusable
The point of a template is that next period you do not rebuild it. A few habits keep the Excel ad reporting template reusable:
- Use Excel Tables. Format the Raw Data range as a Table (Insert, Table). When you paste a longer dataset, formulas in calculated columns fill down automatically and your summary references expand with it.
- Reference, never retype. The summary tab should pull from the calculation columns with formulas, so updating the raw data updates everything downstream.
- Lock the layout. Once the formulas work, protect the calculation and summary cells so a stray paste does not overwrite a formula.
- Date every export. Keep the period column accurate so your period-over-period formulas line up against the correct prior range.
What the manual rebuild actually costs
The honest trade-off with any Facebook Ads Excel template is time. The template is free and bends to whatever layout you want. But every period you open Ads Manager, export the numbers, paste them in, check the date ranges, and fix any column that shifted. For one account that is a manageable chore. Across several accounts, or when a client expects a report on the same day each week, the repetition adds up. There is also a reconciliation gotcha worth knowing: because of iOS and App Tracking Transparency, Meta tends to undercount some conversions, so the figures in your sheet reflect Meta-native reporting, not a blended view. The spreadsheet does not change that, but it helps to label the source so nobody reads the number as absolute truth. For the wider trade-off between exporting and using a live view, see Facebook Ads Manager vs reporting dashboard.
Where a native export removes the rebuild
If the monthly paste-and-check loop is the part you want gone, a tool that exports the report for you is the shortcut. DashOps reads every Meta KPI across your ad accounts, including spend, ROAS, CPC, CPM, CTR and cost per lead, with period-over-period comparison already built in, and exports it to Excel, CSV or PDF without the manual rebuild. For agencies and freelancers sending these to clients, the same data can go out as a white-label report, covered in white-label client reporting. See what each plan includes on the pricing page, and the help center walks through connecting an account.
Build the Excel version once to learn exactly which numbers matter to you, then decide whether the monthly rebuild is worth your time or worth automating.
Frequently asked questions
What columns should a Meta Ads report template in Excel include?
What is the ROAS formula for an Excel ad reporting template?
Is an Excel template better than a connected Meta Ads dashboard?
See it in your own dashboard
DashOps brings Meta Ads reporting, campaign management, and white-label client portals into one place. Pick the plan that fits how you run ads.