17 Meta Ads Metrics Explained: Definitions and Formulas
A clear set of Meta ads metrics explained in one place saves you from guessing what each number means when you open Ads Manager or a report. This glossary defines 17 core Meta (Facebook and Instagram) Ads metrics with a plain-English meaning and a one-line formula for each, grouped by what they measure: cost, engagement, reach, and outcomes. Use it as a reference: skim to the metric you need, read the definition, check the formula, and move on. Every metric below is one DashOps reports on across your connected ad accounts, so the same definitions apply whether you read them in Ads Manager or in a dashboard.
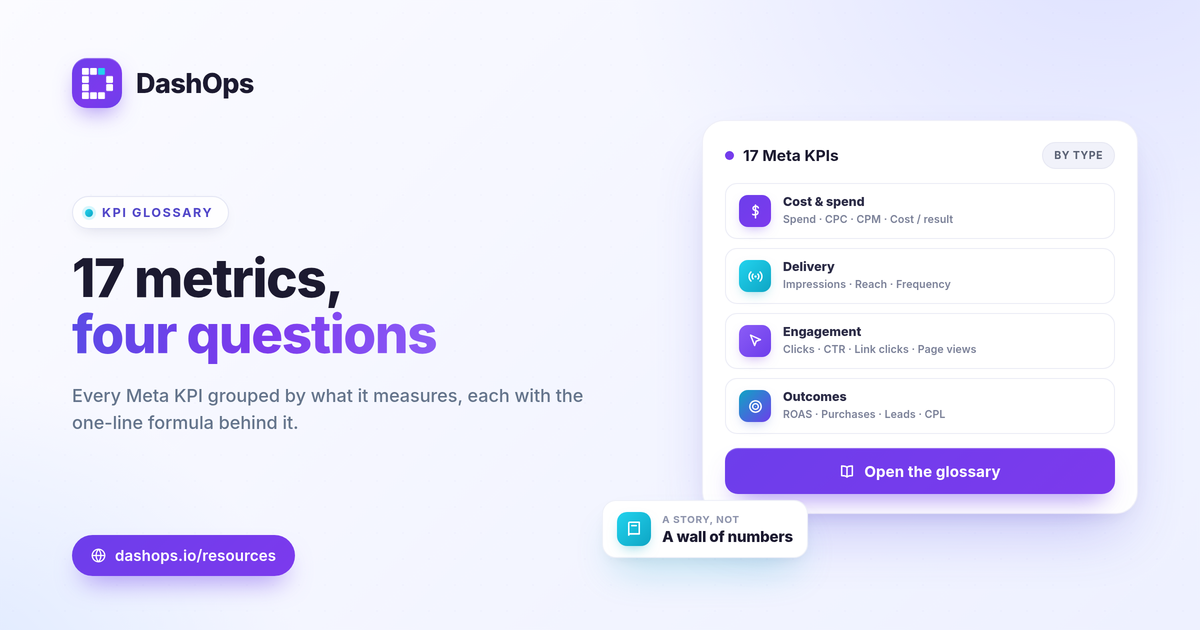
How to read this Facebook Ads metrics glossary
Metrics fall into a few buckets. Spend tells you what went out. Delivery metrics (impressions, reach, frequency) tell you how often your ads were shown. Engagement metrics (clicks, CTR) tell you how people responded. Cost metrics (CPC, CPM, cost per result) tell you what each action cost. Outcome metrics (purchases, leads, ROAS, cost per lead) tell you whether the money worked.
No single number is the whole story. A low CPC means little if those clicks never convert, and a high CPM is only a problem if your results are not keeping pace. Read each metric next to the goal it serves, and against your own prior period rather than a universal “good” number.
Cost and spend metrics
These describe what you paid and how efficiently you paid it.
- Spend (amount spent). The total you were charged for delivering ads in the selected period. This is the denominator for almost every efficiency metric below. There is no formula: it is the raw cost Meta billed.
- CPC (cost per click). The average cost of a single click. Formula: CPC = spend / clicks. Watch whether this counts all clicks or link clicks, since the two differ.
- CPM (cost per mille). The cost to show your ad one thousand times. Formula: CPM = spend / impressions times 1000. CPM reflects auction competition and audience demand more than your creative.
- Cost per result. The cost of one instance of your chosen objective, whatever you optimized for. Formula: cost per result = spend / results. It generalizes cost per purchase and cost per lead into a single comparable number.
Delivery and reach metrics
These describe how widely and how often your ads were served.
- Impressions. The number of times your ads were displayed, counting repeats. One person can generate many impressions. There is no formula: it is a count.
- Reach. The number of unique people who saw your ads at least once. Reach is always equal to or lower than impressions.
- Frequency. The average number of times each person saw your ads. Formula: frequency = impressions / reach. Rising frequency alongside a falling CTR is a common early sign of audience fatigue.
If reach, impressions, and frequency tend to blur together, the explainer on reach vs impressions vs frequency walks through how each one behaves as you scale spend.
Engagement and click metrics
These describe how people interacted with your ads.
- Clicks (all). Every click on the ad, including likes, comments, profile taps, and link clicks. A count, not a formula.
- Link clicks. Clicks that specifically open your destination URL. This is usually the more meaningful click number for performance, and it can differ a lot from all clicks.
- CTR (click-through rate). The share of impressions that produced a click, expressed as a percentage. Formula: CTR = clicks / impressions. CTR is a quick read on whether your creative and offer match the audience.
- Landing page views. The count of people who clicked a link and actually loaded your page. The gap between link clicks and landing page views points to page speed or drop-off issues, covered in link clicks vs landing page views.
Outcome metrics: e-commerce
These describe sales results and return.
- Purchases. The count of purchase conversions Meta attributed to your ads within the chosen attribution window. A count, reported through the pixel or Conversions API.
- Conversion value (purchase value). The total tracked revenue from those purchases. The basis for ROAS.
- ROAS (return on ad spend). Tracked revenue per unit of spend. Formula: ROAS = conversion value / spend. To judge whether a given ROAS is healthy, compare it to your break-even ROAS, which is 1 / profit margin, rather than to a number from someone else’s account.
- Cost per purchase. What each sale cost in ad spend. Formula: cost per purchase = spend / purchases. This is your cost per result when the objective is sales.
Outcome metrics: lead generation
These describe lead results for lead-gen accounts.
- Leads. The count of lead conversions, often submissions from Meta Instant Forms or pixel-tracked form completions. A count. One practical note on Instant Forms: Meta only lets you download leads directly from the Page for a limited window (about 90 days), after which they have to be pulled through the API or a connected tool, so it pays to export or sync them promptly.
- Cost per lead (CPL). The average spend to acquire one lead. Formula: cost per lead = spend / leads. A low CPL is only good if those leads are qualified, so read it next to lead quality rather than alone. The distinction between ROAS, CPL, and CPA is worth knowing before you set targets.
Why your reported numbers may not match reality
Two metrics can be defined correctly and still disagree with your own records. Meta credits conversions within an attribution window, so a purchase may land on a different day than your store logs it. iOS privacy changes limit some tracking signals, which tends to cause undercounting rather than overcounting. None of this means the metrics are wrong; it means you should treat Meta-native numbers as a directional view of ad performance and reconcile totals against your actual sales or CRM. DashOps reports these Meta-native figures as Meta defines them, so the definitions in this glossary hold whether you read them in Ads Manager or a dashboard.
Putting the metrics to work
A metric is only useful inside a goal. For an e-commerce account, the chain runs spend to impressions to clicks to purchases to ROAS, and each cost metric explains the step before it. For lead gen, it runs spend to clicks to leads to cost per lead. If you are deciding which of these 17 deserve a permanent spot in your reports, the guide to Meta Ads KPIs to track narrows the list by goal.
DashOps pulls all 17 of these metrics across every connected Meta ad account into one dashboard, with period-over-period comparison and demographic and placement breakdowns so a moving number has context. The adaptive KPIs shift between e-commerce and lead-gen views automatically. See what each plan covers on the pricing page, and the help center walks through connecting an account.
The takeaway: learn the formula behind each metric once, and every report you read afterward becomes a story you can follow rather than a wall of numbers.
Frequently asked questions
What are the most important Meta Ads metrics to track?
How do you calculate ROAS for Meta Ads?
Why do Meta Ads metrics not match my actual sales?
See it in your own dashboard
DashOps brings Meta Ads reporting, campaign management, and white-label client portals into one place. Pick the plan that fits how you run ads.