Meta Ads Dashboard vs Spreadsheets: Why Manual Reporting Stops Scaling
Where the spreadsheet wins, and where it stops
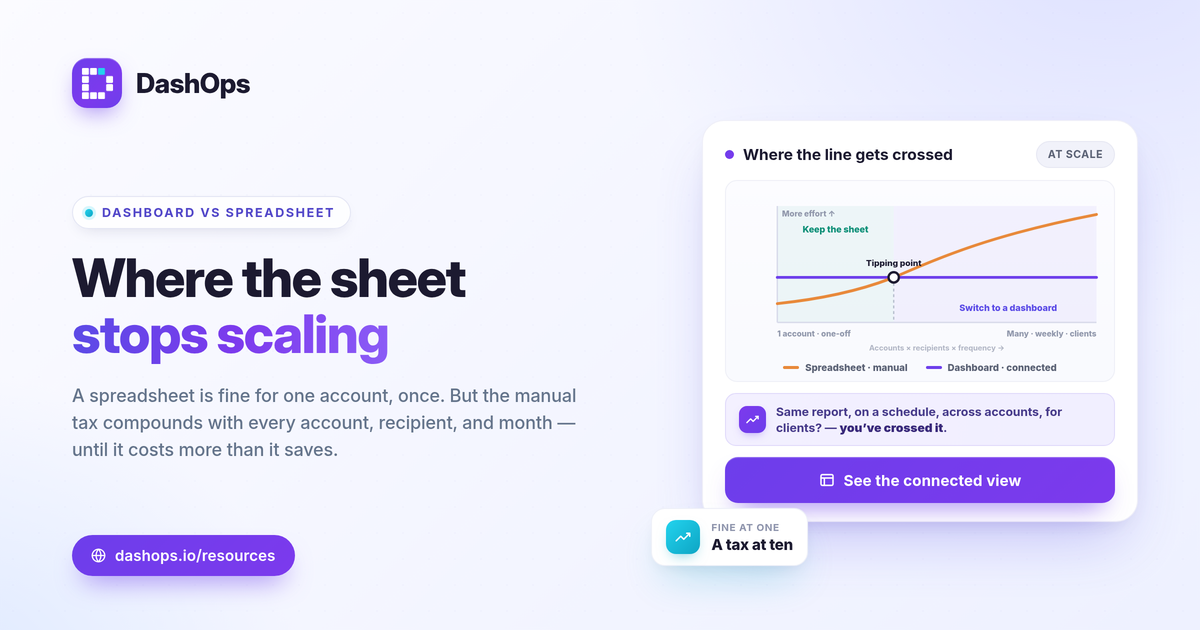
A Meta Ads dashboard vs spreadsheets is not really a fight about formulas. A spreadsheet is excellent at the start: one ad account, a handful of campaigns, a monthly export from Ads Manager pasted into a tidy grid. The trouble is that manual reporting carries a hidden tax that grows every month, and that tax compounds as you add accounts, clients, and metrics. The question is not whether a spreadsheet can hold the numbers. It can. The question is whether you want to rebuild the same report by hand forever, and whether the numbers stay trustworthy once a human is copying and pasting them under deadline. This post lays out exactly where the spreadsheet vs dashboard Meta ads line gets crossed.
The manual reporting tax nobody budgets for
Every manual Facebook Ads reporting spreadsheet hides recurring work that never shows up on an invoice. You pay it anyway, in hours.
- The export step. Open Ads Manager, set the date range, pick columns, export, download, open the file.
- The paste and reshape step. Copy figures into your template, fix column order, re-apply formatting that broke.
- The recalculation step. Re-check that CPC, CPM, CTR, and ROAS formulas still point at the right cells after rows shifted.
- The comparison step. Pull last period too, line it up, and compute the change by hand.
Each step is small. Multiply by the number of accounts and the number of report recipients, then repeat every week or month. That is the rebuild-every-month tax, and it is the core reason to stop manual ad reporting once volume rises.
Where manual reporting breaks as you scale
The break is rarely dramatic. It arrives quietly as your account count and stakeholder list grow.
- One account is fine. Five is a project. Managing multiple Meta ad accounts by hand means five exports, five tabs, five chances to paste into the wrong place. A connected view reads them together. See managing multiple Meta ad accounts for how that consolidation works.
- Formulas drift. A column moves in the export, a cell reference silently points one row off, and the ROAS in your report no longer matches Ads Manager. Nobody notices until a client does.
- Breakdowns get skipped. Age, gender, and placement breakdowns are tedious to rebuild manually, so they quietly drop out of the report. That is exactly the data that explains rising costs and creative fatigue.
- Comparison becomes optional. Period-over-period takes real effort in a spreadsheet, so it gets dropped on busy weeks, and the report loses the one thing the reader actually wants: what changed.
Automated vs manual reporting: what actually differs
The honest comparison is not features against features. It is what each approach costs you in time and trust at volume.
| Dimension | Spreadsheet (manual) | Connected dashboard (automated) |
|---|---|---|
| Data entry | Export and paste each period | Pulled from Meta on connect |
| Multiple ad accounts | One file or tab per account | One view across accounts |
| Period-over-period | Built by hand each time | Built in |
| Breakdowns (age, gender, placement) | Manual and often skipped | Always available |
| Risk of stale or wrong numbers | High, grows with volume | Low, reads Meta-native figures |
| Client-ready output | Reformat every time | Export to PDF, Excel, CSV |
Automated vs manual reporting comes down to this: the dashboard removes the parts a human does badly under deadline, which is copying, reshaping, and recomputing, and keeps the parts a human does well, which is reading the result and deciding what to do.
The numbers stay honest either way
Switching off the spreadsheet does not change what Meta reports. A connected dashboard shows Meta-native figures, the same numbers you would export from Ads Manager, just without the manual handling in between. The formulas are unchanged: CTR = clicks / impressions, CPC = spend / clicks, CPM = spend / impressions times 1000, ROAS = conversion value / spend, and cost per lead = spend / leads. What you stop doing is re-entering them by hand.
This also matters for lead data specifically. Meta only lets you download Instant Form leads directly from the Page for a limited window, about 90 days, after which leads have to come through the API or a connected tool. A monthly manual export can quietly miss leads that age out. A connected pipeline captures them before that window closes. And keep in mind that iOS and App Tracking Transparency cause conversions to be undercounted in Meta’s reporting, so the way to judge a “good” result is against your own goals, your margin, and your prior-period trend, not a universal benchmark you copy from elsewhere.
When a spreadsheet is still the right call
A dashboard is not always the answer, and it is fair to say so.
- A one-off analysis. If you are slicing data once for a specific question, a manual export is quick and disposable.
- A single tiny account, reported rarely. If you run one account and report once a quarter, the manual tax is small.
- Custom modeling Meta does not provide. If you are building a bespoke calculation on top of the raw numbers, a spreadsheet gives you that freedom.
The tipping point is repetition. The moment you are rebuilding the same report on a schedule, across more than one account, for someone other than yourself, the spreadsheet is costing more than it saves.
Choosing your line
A simple test: count how many times you will produce this exact report this year, and how many accounts feed it. If the answer is “once, one account,” keep the spreadsheet. If it is “every week or month, across several accounts, for clients or stakeholders,” you have already crossed the line where manual reporting stops scaling. For more on what belongs in the report itself, see Meta Ads KPIs to track, and for how a purpose-built tool differs from the raw export, Facebook Ads Manager vs a reporting dashboard.
DashOps is built for the point where the spreadsheet stops scaling: it connects your Meta ad accounts, reads 17 plus KPIs with period-over-period comparison and breakdowns in one place, and exports client-ready PDF, Excel, and CSV reports, with white-label client reporting on Growth and Enterprise. See what each plan includes on the pricing page, and the help center walks through connecting an account.
The practical takeaway: keep the spreadsheet for one-off questions, and move to a connected dashboard the moment you find yourself rebuilding the same report on a schedule.
Frequently asked questions
Is a Meta Ads dashboard better than a spreadsheet?
Will a dashboard change my Meta numbers compared to my spreadsheet?
When should I stop using a spreadsheet for Facebook Ads reporting?
See it in your own dashboard
DashOps brings Meta Ads reporting, campaign management, and white-label client portals into one place. Pick the plan that fits how you run ads.