Looker Studio vs Excel vs a Reporting Dashboard for Facebook Ads Report Templates
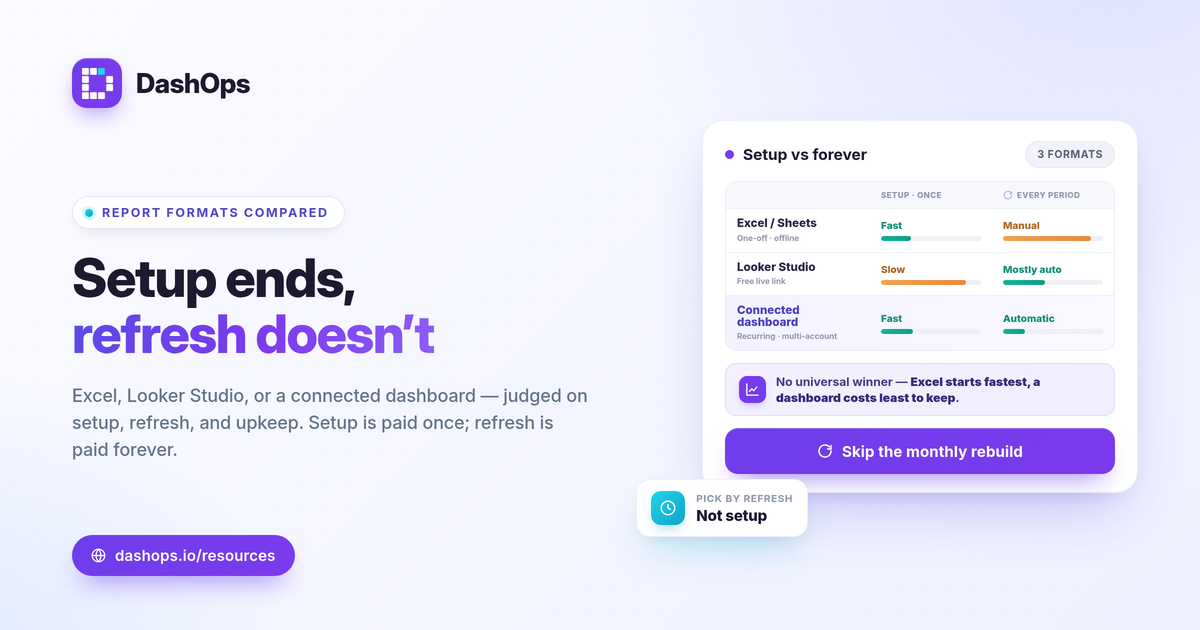
A Facebook Ads report template comparison really comes down to three questions: how long does it take to set up, how painful is each refresh, and how much work does it cost you every month after that. Excel wins on getting started and offline control. Looker Studio wins on shareable live links once it is built. A connected dashboard wins on refresh and maintenance because the data is already wired in. None is universally best. The right choice depends on how often you report, how many ad accounts you run, and whether you would rather spend your time building the template or reading the numbers.
The three formats, in one sentence each
Before scoring them, here is what each option actually is when you sit down to report on Meta Ads.
- Excel (or Google Sheets). You export numbers from Ads Manager, paste them into a formatted file, and build your own charts and formulas. Total control, zero automation by default.
- Looker Studio. A free Google reporting tool where you connect a data source, drag in charts, and share a live link. More automated than a spreadsheet once the template exists, but you build the layout yourself.
- A connected dashboard. A purpose-built reporting tool that reads your Meta KPIs directly, with the charts, comparisons and breakdowns already in place. You pick a date range instead of building a report.
This is the core of the Looker Studio vs Excel Facebook Ads decision, with the dashboard as the third path that removes most of the manual steps from both.
Setup: how long until you see a finished report
Setup is where Excel feels easiest and a dashboard feels easiest, for opposite reasons.
- Excel. Fastest to a first draft. Open a blank file, paste an export, format a few cells. The catch is that everything you want, totals, period comparison, charts, you build by hand.
- Looker Studio. Slowest of the three to a polished template. You connect a source, lay out pages, set date controls, and style each chart. The payoff comes later, not on day one.
- Connected dashboard. Setup is connecting your Meta ad account once. The KPIs, trend charts and breakdowns are already designed, so there is no template to build at all.
If you only ever report once, Excel often wins on raw speed. If you report on a schedule, the time you save later matters more than the first hour.
Refresh: what happens next period
This is the dimension people underestimate, and it is where the formats separate most clearly.
- Excel. Every refresh is a fresh export and paste. You re-pull the date range from Ads Manager, drop it in, and check that your formulas still point at the right cells. Manual every time.
- Looker Studio. Refresh is easier because the connector re-queries the source. You usually just change the date range. Connector quirks and authentication prompts can still interrupt you.
- Connected dashboard. Refresh is changing the date selector. The data is pulled for you, and period-over-period comparison updates automatically, so last period sits next to this period without a second export.
A common refresh headache across all three is numbers that do not match Ads Manager. That almost always traces back to a different date range, time zone, or attribution window rather than a broken template. If you hit this, the guide on why Ads Manager numbers do not match reports walks through the usual causes.
Maintenance: the cost you only feel over time
Maintenance is the quiet tax. A template that is cheap to build can be expensive to keep alive.
- Excel. Highest maintenance. New campaigns, renamed campaigns, or an extra ad account all mean editing the file. Broken cell references are easy to miss and hard to spot.
- Looker Studio. Moderate maintenance. The template largely holds, but connector changes, field updates, and access settings need occasional attention, especially when you share with clients.
- Connected dashboard. Lowest maintenance. New campaigns and additional ad accounts appear without a rebuild, and breakdowns by age, gender and placement are already there rather than something you assemble.
Scorecard
Here is the same comparison in one view. Read it against your own situation, not as a universal ranking.
| Criterion | Excel / Sheets | Looker Studio | Connected dashboard |
|---|---|---|---|
| Time to first report | Fast | Slow | Fast |
| Refresh effort each period | Manual export | Mostly automatic | Automatic |
| Ongoing maintenance | High | Moderate | Low |
| Live shareable link | No | Yes | Yes |
| Built-in period-over-period | Build it yourself | Build it yourself | Included |
| Demographic and placement breakdowns | Build it yourself | Build it yourself | Included |
| Best when | One-off or fully custom | Free, flexible, you enjoy building | Recurring reporting, multiple accounts |
Which format fits which situation
The best Facebook Ads reporting format is the one that matches how often you report and how much building you want to do.
- Choose Excel when the report is a one-off, when you need to work offline, or when you want total formula-level control and do not mind redoing the export each time.
- Choose Looker Studio when you want a free, flexible live link, you report often enough to justify building the template, and you are comfortable maintaining a connector.
- Choose a connected dashboard when you report on a recurring schedule, run more than one ad account, or want breakdowns and comparisons without rebuilding anything.
Whichever you pick, decide which KPIs belong in the report first, because the metrics drive the layout. The list in Meta Ads KPIs to track is a useful starting point, and if you are weighing the native interface against a separate reporting layer, Ads Manager vs a reporting dashboard covers that trade in more depth. These are the Meta Ads reporting tools compared on the terms that actually cost you time.
DashOps is the connected-dashboard option in this comparison. It reads your Meta KPIs across every ad account in one place, with period-over-period comparison, demographic and placement breakdowns, and PDF, Excel and CSV exports built in, plus white-label client reports for agencies and teams. See what each plan includes on the pricing page, and the help center covers connecting an ad account and scheduling reports. If you serve clients, white-label client reporting explains the branded view.
The practical takeaway: pick the format by how often you will refresh it, because setup is a one-time cost and refresh is forever.
Frequently asked questions
Is Looker Studio or Excel better for a Facebook Ads report template?
Why do my Looker Studio or Excel numbers not match Ads Manager?
Can I avoid rebuilding a Facebook Ads template every reporting period?
See it in your own dashboard
DashOps brings Meta Ads reporting, campaign management, and white-label client portals into one place. Pick the plan that fits how you run ads.