How to Report on Facebook Ads Purchases and Conversion Value
A clean Facebook Ads purchase report answers one question for whoever reads it: did the ad spend turn into sales, and how much revenue came back. To do that well, you report two numbers side by side, purchase count and conversion value, then divide them by spend to show efficiency. The work is not in pulling the figures, it is in explaining where Meta’s purchase numbers come from and how they relate to the sales your store actually recorded. Here is how to build Facebook Ads purchase reporting that holds up when a stakeholder asks why the dashboard and the bank account disagree.
Start with the four numbers that matter
When you report Meta Ads purchases, lead with the metrics tied to revenue, not every column Meta returns.
- Spend. What you put into the campaigns over the period.
- Purchases. The count of purchase conversions Meta attributed to your ads.
- Conversion value. The total revenue Meta tied to those purchases.
- ROAS. Conversion value divided by spend, the headline efficiency figure.
Two derived metrics make this concrete for e-commerce conversion reporting. Cost per purchase is spend divided by purchases, and it tells you what each sale cost to acquire. ROAS is conversion value divided by spend, and it tells you the return on every dollar. Report both, because cost per purchase can look fine while ROAS is weak if your order values are small, and the reverse is also true.
Explain where Meta’s purchase number comes from
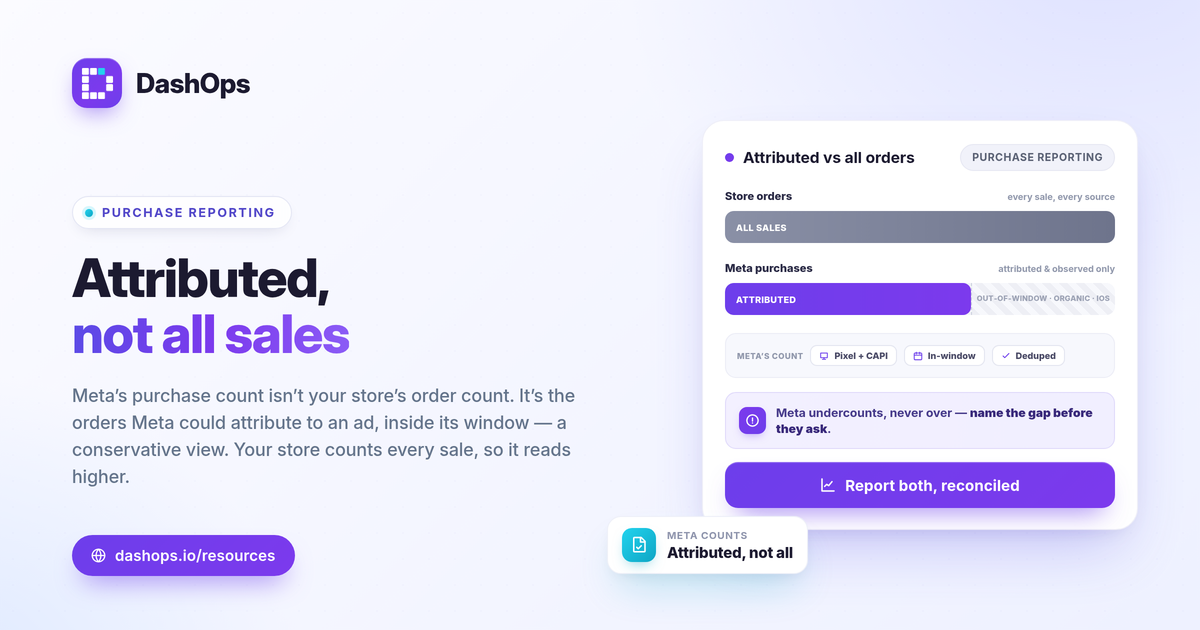
This is the part most reports skip, and it is the part stakeholders ask about. Meta’s purchase count is not your store’s order count. It is the number of purchase events Meta could attribute to one of your ads inside the attribution window you have set.
- The event source. A purchase fires from the Meta Pixel, the Conversions API, or both, when a shopper completes checkout.
- The attribution window. Meta credits a purchase to an ad only if the click or view happened within the window, commonly a seven-day click setting. A sale outside that window is not counted as ad-driven.
- The deduplication. When the Pixel and Conversions API both report the same order, Meta deduplicates so you are not double counting.
Because of this, the same period can show a different purchase count in Ads Manager than in your store admin. Both are correct for what they measure. Meta is reporting attributed sales, your store is reporting all sales. State this in the report rather than letting the reader discover the gap on their own.
Account for undercounting before someone else points it out
Since the iOS App Tracking Transparency changes, Meta cannot observe every conversion it once could, so attributed purchases tend to be undercounted rather than overcounted. The direction matters: if Meta shows fewer purchases than your store recorded, that is the expected pattern, not a broken pixel. When you track purchases in Facebook Ads, frame the Meta figure as a conservative, attributed view and note that real total sales are usually equal or higher.
You do not need a precise adjustment number to be honest about this. A single sentence in the report does the job: these are Meta-attributed purchases within the chosen window, and total store sales may be higher due to attribution limits. That one line prevents a long email later.
Show the trend, not just the period total
A purchase count on its own is a snapshot. The question a stakeholder actually has is whether this period beat the last one.
- Purchases this period vs last. Volume rising or falling.
- Conversion value this period vs last. Revenue rising or falling.
- ROAS this period vs last. Efficiency rising or falling.
Period-over-period comparison turns three flat numbers into a story. A rising purchase count with falling ROAS, for example, usually means you are buying more orders at a worse return, which is a budget conversation. Falling purchases with steady ROAS is a volume conversation. The comparison is what makes the report decision-ready instead of just descriptive. If you report monthly, the monthly Facebook Ads report guide covers the wider structure this fits into.
Add context that explains the number, not just states it
Conversion value reporting gets stronger when you pair the headline with one or two breakdowns that explain movement.
- Top campaigns by purchases and value. Which campaigns drove the orders, so credit lands where it belongs.
- Average order value direction. Conversion value divided by purchases, watched period over period, tells you whether each sale is getting larger or smaller even when ROAS holds.
- A demographic or placement breakdown. When a campaign’s purchase efficiency shifts, the age, gender, or placement split often shows where, which is more useful than a single blended figure.
Keep these as supporting detail under the headline numbers. A report that opens with twelve breakdowns buries the answer. For deciding which top-line metrics belong in the report at all, the Meta Ads KPIs to track post is a good reference, and if you are weighing where to build the report, Ads Manager vs a reporting dashboard lays out the trade-offs.
Present it so a non-buyer understands it
The reader is often not the person who ran the ads. Strip the jargon and lead with plain results.
- One sentence of headline. Spend in, revenue out, return, in that order.
- The trend in words. Up or down versus last period, and by roughly how much.
- The reconciliation note. Meta-attributed purchases versus total store sales, stated once.
- One recommendation. What you would change next period based on the numbers.
If you send these reports to clients, consistency and labeling matter as much as accuracy. A white-label client report keeps the format familiar each period so the reader compares like with like.
DashOps reads Meta’s purchase count, conversion value, ROAS, and cost per purchase straight from your connected ad accounts, with period-over-period comparison and top-campaign and demographic breakdowns built in, so the report and the reconciliation note come together in one place instead of three exports. See what each plan includes on the pricing page, and the help center walks through connecting an account and scheduling the report.
The practical takeaway: report Meta’s attributed purchases and conversion value as their own honest figures, show them against the prior period, and name the gap with store sales before anyone has to ask.
Frequently asked questions
Where does Meta's purchase number come from in my reports?
Why does my Facebook Ads purchase count not match my store sales?
Should I report purchase count or conversion value to stakeholders?
See it in your own dashboard
DashOps brings Meta Ads reporting, campaign management, and white-label client portals into one place. Pick the plan that fits how you run ads.