Monthly Facebook Ads Report Guide: What to Include and How to Build It
A solid monthly Facebook Ads report answers one question for whoever reads it: did the spend do its job last month, and what changed since the month before. Everything else supports that answer. Below is a repeatable monthly Facebook Ads report template you can build once and reuse every cycle: the KPIs to include, how to frame period-over-period comparison and pacing, and how to turn the whole thing into a scheduled digest so it lands in inboxes without manual work. Whether you run one account or several, the goal is the same: a clear read on performance that a non-specialist can follow.
Start with the headline numbers
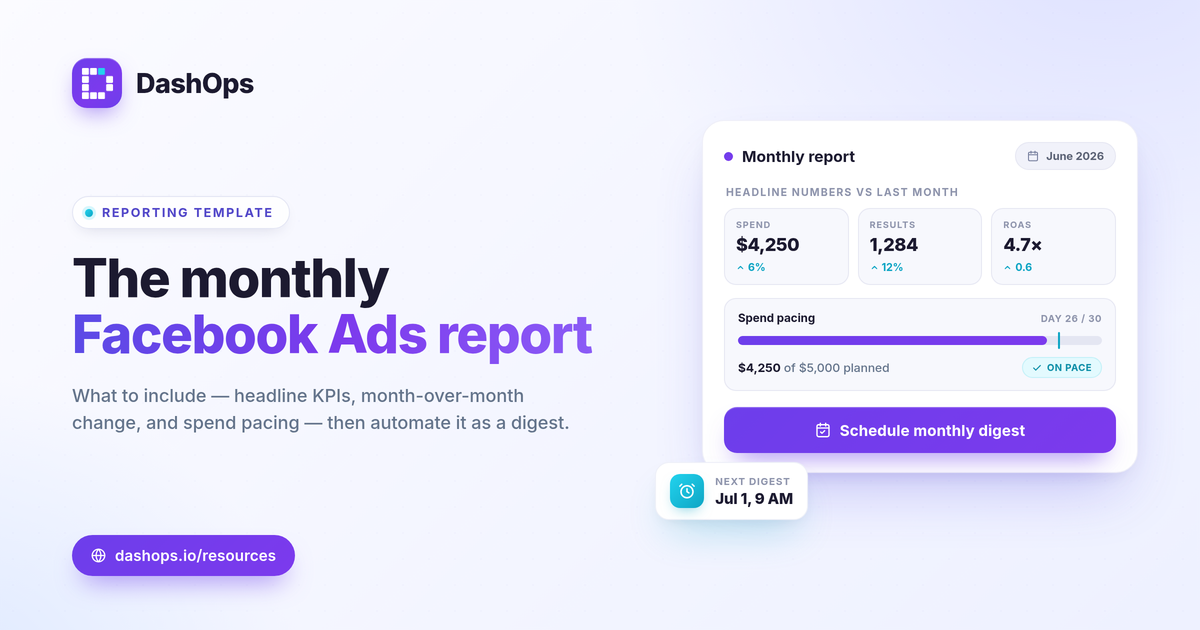
Open your monthly Meta Ads report with the metrics tied to the goal, not every figure Meta returns. The reader wants the verdict first.
- Spend and results. What you spent and what it produced, side by side. Results means purchases for e-commerce or leads for lead-gen.
- Efficiency. Cost per result: cost per purchase or cost per lead. Cost per lead = spend / leads.
- Return. ROAS for sales (ROAS = conversion value / spend) or pipeline value for lead-gen.
Keep this block to a handful of numbers. A monthly ad report template that opens with twelve KPIs buries the one that matters. If you need a fuller list of what each metric means, the guide on Meta ads KPIs to track breaks them down.
Show the trend, not just the total
A single month in isolation hides the story. The question every reader has is whether this month beat last month, so period-over-period comparison belongs next to every headline number.
- This month vs last month. Put the two periods side by side and show the direction of change for spend, results, cost per result, and ROAS.
- Direction over decoration. An arrow or a delta is enough. The reader does not need a paragraph to see that cost per lead moved up or down.
- Context for the change. If spend rose, did results rise with it, or did efficiency slip? The comparison only helps when you pair the what with a short why.
For a deeper walkthrough of reading the change between two periods, see how to compare Facebook Ads month over month.
Include spend pacing
Pacing tells the reader whether the budget was used the way it was meant to be. It is the part of Facebook Ads monthly reporting that catches problems a results table alone misses.
- Planned vs actual spend. Did you spend the full monthly budget, overspend early, or leave money on the table?
- Distribution across the month. A budget burned in the first ten days behaves very differently from one spread evenly, even when the monthly total matches.
- What it signals. Underspend can mean delivery was throttled or a campaign paused unexpectedly. Overspend can mean a rule or a bid change pushed delivery harder than planned.
Pacing turns the report from a backward-looking scoreboard into something you can act on for the month ahead.
Add the breakdowns that explain the result
Headline numbers say what happened. Breakdowns say where it happened, which is what makes a report useful rather than just true.
- Top campaigns. Rank by spend and by result so the reader sees where the budget went and what earned its keep.
- Demographics. Age and gender breakdowns show which audiences responded. A campaign that looks flat overall can be strong in one segment and weak in another.
- Placements. Feed, Stories, Reels, and the rest rarely perform identically. The placement breakdown shows where efficiency lives.
You do not need every breakdown every month. Include the ones that explain this month’s movement. If frequency is climbing while results soften across the same audience, that pattern is worth surfacing, since rising frequency against falling results is a fatigue signal worth a note.
Judge the numbers against your own goals
Resist the urge to label a number good or bad against some universal benchmark. A monthly Facebook Ads report is more honest, and more useful, when it judges performance against three things you actually control.
- Your goal. A cost per lead is fine if it sits inside what a lead is worth to you, and a problem if it does not.
- Your margin. For e-commerce, break-even ROAS = 1 / profit margin. That is the line your ROAS has to clear before the spend is profitable, and it is specific to your business.
- Your prior period. The most reliable yardstick is your own last month. Trend beats any borrowed average.
One honesty note worth carrying into every report: iOS privacy changes cause Meta to undercount some conversions, so treat reported results as directional rather than exact, especially for purchases attributed after a click.
Turn the template into a scheduled digest
The work in a monthly report is not the analysis, it is the repetition. Once the structure above is fixed, the build should be automatic.
| Step | What it does |
|---|---|
| Define the report once | Lock the KPIs, comparison window, and breakdowns |
| Set the schedule | Choose monthly delivery on a fixed day |
| Pick recipients | Send to yourself, a teammate, or a client list |
Automating the send removes the two failure modes of manual reporting: forgetting to run it, and rebuilding the layout from scratch each cycle. For the full mechanics, see how to automate Meta Ads reports.
DashOps builds this monthly Facebook Ads report for you from your connected Meta accounts. It reads 17+ KPIs across every connected ad account in one dashboard with period-over-period comparison and pacing built in, then sends the whole thing as a scheduled email digest, a white-label client report, or a PDF, Excel, or CSV export. See what each plan covers on the pricing page, and the help center walks through connecting an account and setting the schedule.
Build the template once around your goal, margin, and last month’s numbers, and the monthly report stops being a chore and starts being a decision tool.
Frequently asked questions
What should a monthly Facebook Ads report include?
How is a monthly Facebook Ads report different from a weekly one?
How do I know if my monthly numbers are good?
See it in your own dashboard
DashOps brings Meta Ads reporting, campaign management, and white-label client portals into one place. Pick the plan that fits how you run ads.