Facebook Ads Dashboard for Ecommerce Brands: Tracking ROAS, Purchases and Pacing in One View
A Facebook Ads dashboard for ecommerce brands earns its place by answering one question on sight: are these ads producing profitable sales, and is the budget on track. For a DTC or ecommerce store, that means ROAS, purchases, conversion value and spend pacing sitting at the top of the view, not buried under impressions and reach. The reason is simple. A clothing brand and a lead-gen law firm care about different numbers, and a dashboard that shows everything equally shows nothing clearly. Below is what belongs front and center for a store, why it matters, and how an adaptive Meta Ads dashboard surfaces the right KPIs automatically.
Lead with the numbers that decide profitability
Open with the metrics tied to revenue, then let everything else support them. For ecommerce Meta Ads reporting, the headline set is small on purpose.
- Spend and purchases. What you spent and how many orders it drove, side by side.
- Conversion value. The total sales value Meta attributes to your ads, not just the order count.
- ROAS. The core efficiency number. ROAS = conversion value / spend. A ROAS of 4 means four currency units back for every one spent.
- Cost per purchase. Spend / purchases. This is your acquisition cost per order, and it is where rising CPMs show up first.
These four tell you whether the money worked. Everything that follows explains why it did or did not.
Why ROAS belongs at the top of a DTC dashboard
ROAS is the number a store owner checks first because it ties spend directly to revenue. A ROAS dashboard for ecommerce keeps that figure visible alongside its trend, so you see not just today’s number but whether it is climbing or sliding.
The catch with ROAS is that there is no universal “good” number. A brand selling high-margin digital products can thrive at a ROAS that would bankrupt a low-margin reseller. The honest way to judge ROAS is against your own break-even point. Break-even ROAS = 1 / profit margin, so a store with a 25 percent margin needs a ROAS of 4 just to cover costs. Anything above that line is profit; anything below is a loss, no matter how healthy the raw number looks. Track your ROAS against that target line and against last period’s trend rather than chasing a figure you read somewhere. For a full walkthrough, see calculate break-even ROAS for your store.
Purchases and conversion value, not just orders
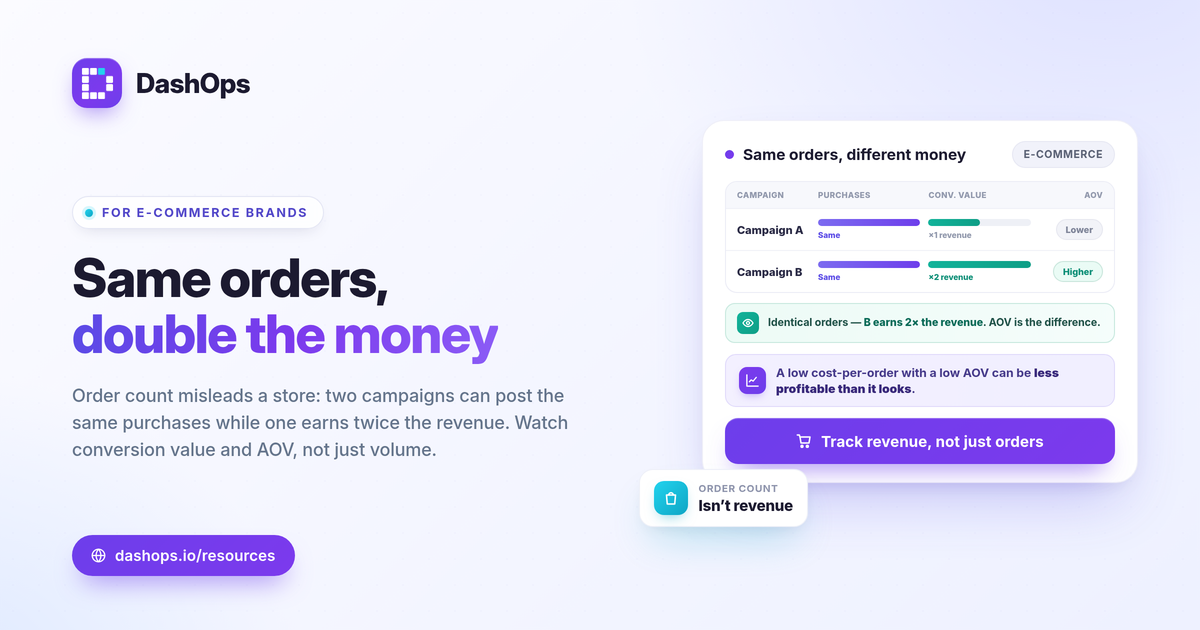
Order count alone hides the money. Two campaigns can drive the same number of purchases while one brings in twice the revenue because its buyers spend more per order.
- Purchases tell you volume.
- Conversion value tells you revenue.
- Average order value sits between them: AOV = conversion value / purchases.
Watching all three together shows whether a campaign is winning on volume, on basket size, or both. A campaign with a lower cost per purchase but a much lower AOV may actually be less profitable than it appears. A DTC Facebook Ads dashboard that reports purchases and conversion value side by side keeps that distinction visible instead of letting a tidy order count mislead you.
Track purchases and ROAS against the prior period
A single number is a snapshot. The story is in the change. Period-over-period comparison answers the question every store owner actually has: is this week or month better than the last one, and by how much.
Trend charts make this concrete. When you can see ROAS and cost per purchase plotted over time, a slow decline becomes obvious weeks before it would in a static monthly total. Rising cost per purchase paired with climbing frequency is a classic fatigue signal, and reading frequency as a KPI alongside the trend helps you catch it early. More on that in reading ad frequency to catch fatigue.
Spend pacing keeps the budget honest
Tracking ROAS without tracking pace is half the picture. A campaign can post a strong ROAS while quietly burning through the month’s budget in two weeks, or underspending so badly it never reaches scale.
A spend pacing view plots cumulative spend against your planned budget and against the same point last period. That tells you whether you are ahead, behind, or on track while there is still time to adjust the budget. For stores running seasonal pushes or fixed monthly budgets, this is the difference between a controlled flight and a surprise at month-end. Budget pacing alerts can do the watching for you, flagging an overspend before it lands.
How an adaptive dashboard picks the right KPIs
The reason a store should not have to configure all of this manually is that a good Meta Ads dashboard reads your account and adapts. When your campaigns are optimized for purchases and conversion value, the dashboard leads with ecommerce KPIs: ROAS, purchases, cost per purchase, AOV. When an account is lead-focused, the same dashboard switches to leads and cost per lead instead. The difference between the two setups is covered in lead-gen vs ecommerce Meta KPIs.
This adaptive behavior matters because it removes the setup tax. You connect the ad account and the right numbers are already in front of you, in priority order, with comparison and trends attached.
One honest note on the numbers
Meta-reported ROAS and your store’s actual sales rarely match to the decimal, and that is expected. A dashboard reports Meta-native numbers inside your chosen attribution window, while your store counts every order from every source. iOS and ATT privacy changes also cause Meta to undercount conversions, which can make ad-reported ROAS look lower than your true return. The fix is not to pick the flattering number. It is to read both, keep your attribution window and time zone consistent across every report, and judge the trend rather than any single figure.
DashOps reads 17 plus Meta KPIs across your ad accounts in one dashboard, with period-over-period comparison, demographic and placement breakdowns, top campaigns and spend pacing built in, and it adapts to show ecommerce KPIs when your account is sales-focused. See what each plan includes on the pricing page, and the help center covers connecting an ad account. For the wider KPI picture, the Meta Ads KPIs to track guide is a good companion read.
The practical takeaway: put ROAS, purchases, conversion value and spend pacing where you see them first, judge each against your own margin and last period’s trend, and let the dashboard surface the rest.
Frequently asked questions
What KPIs should a Facebook Ads dashboard for ecommerce show first?
Why does my dashboard ROAS differ from my store's reported sales?
How do I track spend pacing so I do not overspend mid-month?
See it in your own dashboard
DashOps brings Meta Ads reporting, campaign management, and white-label client portals into one place. Pick the plan that fits how you run ads.