How to Build a Creative Performance Report for Facebook Ads
A Facebook Ads creative performance report answers one question: which ads are actually earning attention and results, and which are quietly draining budget. You build it by reporting at the ad and creative level instead of the account or campaign level, then comparing each creative on CTR and cost per result over time. That view tells you which hooks and formats to scale, which to pause, and which strong performers are starting to fatigue. Below is a practical way to structure that report so the refresh decision is obvious rather than a guess.
Why creative level reporting beats account level
Account and campaign totals tell you whether the money worked. They do not tell you why. Two campaigns with the same ROAS can be carried by one standout video and dragged down by three tired static images, and the account total hides all of it.
Creative level reporting Meta surfaces the unit that you actually change: the individual ad. When you report at the ad level, you can see which creative drives clicks cheaply, which converts after the click, and which is burning impressions without earning either. That is the difference between a report you read and a report you act on.
If you want a refresher on the underlying metrics before you build this, the Meta Ads KPIs to track post covers what each number means.
The metrics that belong in a creative report
Keep the columns tight. A good ad creative reporting Meta view is one row per ad with the numbers that drive a decision:
- Spend. How much each creative consumed. Low-spend ads need more data before you judge them.
- Impressions and reach. How many times the ad showed and how many people saw it.
- Frequency. Average impressions per person. Rising frequency is an early fatigue signal.
- CTR. Clicks divided by impressions. This is your hook and thumb-stop signal. CTR = clicks / impressions.
- Cost per result. Spend divided by your primary result, whether that is a purchase or a lead. Cost per lead = spend / leads.
- Results. Purchases or leads, so you can weight efficiency against volume.
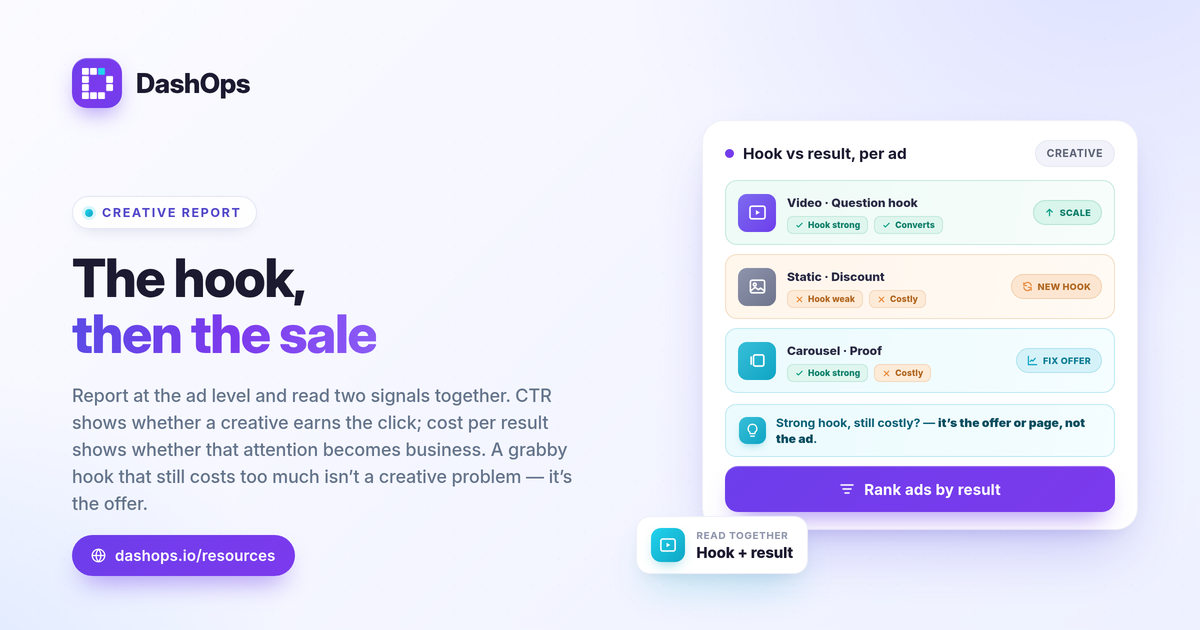
CTR tells you whether the creative earns the click. Cost per result tells you whether that attention turns into business. You need both, because a high CTR ad with a poor cost per result usually points to a mismatch between the hook and the offer.
How to judge “best performing” without a universal benchmark
There is no single CTR or cost per result number that means good across every account. The honest way to judge a creative is against three references:
- Your own goal. A creative that hits your target cost per result at real spend is working, regardless of what any benchmark says.
- Your margin. For e-commerce, compare ROAS to your break-even ROAS, which is 1 divided by your profit margin. ROAS = conversion value / spend.
- Your prior period. A creative that is getting more expensive week over week is fading even if it still looks fine in isolation.
Rank active ads by cost per result first, then read CTR alongside it. A low CTR with a high cost per result points to a weak hook. A strong CTR with a high cost per result points to a landing page or offer problem, not the creative. For more on choosing the right efficiency metric, see ROAS vs CPL vs CPA explained.
Spotting ad fatigue in the creative report
Ad fatigue is the reason yesterday’s winner becomes today’s drain, and a creative level report is where you catch it. The pattern is consistent and visible in a period-over-period view:
- Frequency climbs. The same people see the ad more often.
- CTR falls. The audience has stopped reacting to the hook.
- Cost per result rises. You pay more for each outcome as response drops.
When all three move together for a single creative across consecutive periods, that is your ad fatigue creative report signal to refresh. Refresh the specific tired ads, not the whole campaign, and keep the creatives that are still performing. A period-over-period comparison turns this from a hunch into a decision you can defend.
Group creatives by hook and format
The point of reporting at the creative level is to learn what to make next. To do that, look past individual ads and group them by what they have in common:
- By hook. Question openers, problem-first, social proof, offer-led. Which angle consistently earns the cheapest clicks.
- By format. Video, static, carousel. Which format your audience responds to.
- By message. Discount-led versus benefit-led versus testimonial.
Once you see that, for example, video hooks lead and static carousels lag, your next production round writes itself. This is how a report stops being a backward-looking summary and starts directing the work.
Add the breakdowns Meta already gives you
Two native Meta breakdowns make a creative report sharper without any extra tracking. A demographic breakdown by age and gender shows whether a creative resonates with the audience you care about or only with people unlikely to convert. A placement breakdown shows whether a creative that looks weak overall is actually strong in Feed and dragged down by a placement it was never designed for. Both are reported directly from Meta numbers, so they reconcile with what Ads Manager shows.
One caveat worth stating plainly: iOS privacy changes cause some conversions to go underreported, so a creative may perform slightly better than its tracked cost per result suggests. Read the trend and the relative ranking between creatives rather than treating any single absolute number as exact.
Keep the report consistent and repeatable
A creative report is most useful when it looks the same every period, because the value is in the comparison. Lock the columns, lock the date logic, and review on the same cadence. If you report to clients or stakeholders, a consistent creative section also makes your refresh recommendations easy to follow. If you are deciding where this report should live, Facebook Ads Manager vs a reporting dashboard walks through the trade-offs.
Building this by hand each week is slow, and that is where a dedicated creative level reporting dashboard helps. DashOps reads your ad-level metrics, frequency, and demographic and placement breakdowns across every connected Meta ad account, with period-over-period comparison built in so fatigue shows up on its own. For agencies and freelancers, the same data feeds white-label client reporting so the creative story reaches clients cleanly. See what each plan includes on the pricing page, and the help center covers setup.
The practical takeaway: rank your ads by cost per result, watch CTR and frequency move together over time, and refresh the specific creatives that are fading rather than rebuilding the whole campaign.
Frequently asked questions
What metrics belong in a creative performance report?
How do I know which ad creative is the best performer?
Can a creative report show ad fatigue?
See it in your own dashboard
DashOps brings Meta Ads reporting, campaign management, and white-label client portals into one place. Pick the plan that fits how you run ads.