How to Report on E-commerce Facebook Ads Results: A Step-by-Step Guide
An ecommerce Facebook Ads report has one job: show whether the ad spend produced profitable sales, and explain what changed since last period. Everything else is supporting detail. The core of it is three numbers read together: ROAS (did the money return more than it cost), purchases (how many sales), and average order value (how big each sale was). This guide walks through pulling raw Meta Ads data into a clean report that answers those questions, in an order a store owner or client can follow without a marketing degree.
Start with the result, not the activity
Open the report with outcomes, not impressions. The first thing anyone reading an ecommerce Facebook Ads report wants to see is the money in and the money out, side by side.
- Spend. What you put in over the period.
- Purchases. How many sales the ads drove.
- Purchase value (revenue). The total order value those purchases represent.
- ROAS. Return on ad spend, the headline efficiency number.
These four lines tell the whole story at a glance. Everything after this section exists to explain them. Resist the urge to lead with reach or CTR, which describe activity, not results. A reader who only sees the top section should already know if the period was good or bad.
Get the three sales metrics right
For a Meta Ads e-commerce dashboard, three calculated metrics carry most of the meaning. State the formulas so the numbers are reproducible:
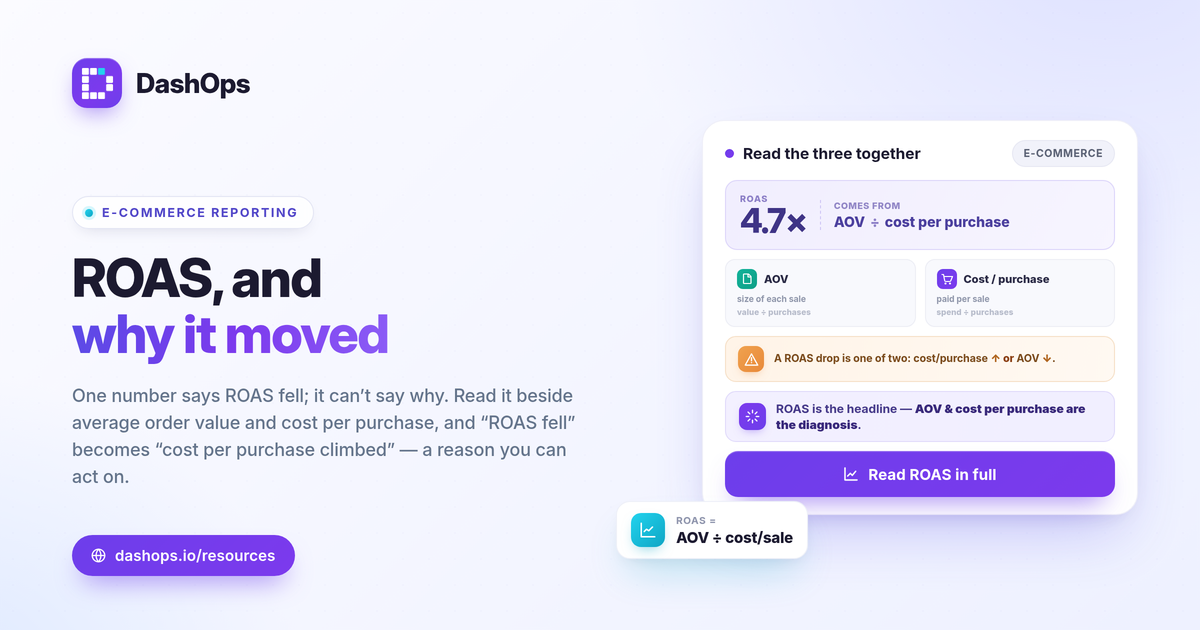
- ROAS = conversion value / spend. A ROAS of 3 means every dollar spent returned three dollars of order value.
- Average order value (AOV) = purchase value / purchases. This tells you the size of a typical sale, which matters because the same ROAS can come from many small orders or a few large ones.
- Cost per purchase = spend / purchases. What you paid to acquire one sale.
ROAS is the headline, but AOV and cost per purchase are what let you diagnose it. If ROAS dropped, the cause is usually one of two things: you paid more per purchase, or each purchase got smaller. Showing all three together turns “ROAS fell” into “ROAS fell because cost per purchase climbed while AOV held steady,” which is a sentence someone can act on rather than just a number that moved.
Show the trend, not just the total
A single number hides the story. The question a store owner actually has is “did this month beat last month,” and the only way to answer it is a period-over-period comparison. For every headline metric, show the current value next to the prior period and the change.
- Spend this period vs last period.
- ROAS this period vs last period.
- Purchases and AOV this period vs last period.
Add a trend chart of daily spend against daily purchase value so seasonality and spikes are visible. A flat ROAS for the month can still hide a strong first week and a collapsing fourth week, and only the trend line shows it. For a fuller breakdown of how to read each KPI on its own, the 17 Meta Ads KPIs guide covers the supporting metrics.
Judge “good” against your own margin
There is no universal good ROAS, and any report that implies one is misleading. What counts as good depends entirely on your profit margin and your goal for the campaign.
The honest benchmark is your break-even ROAS, calculated as break-even ROAS = 1 / profit margin. A store running a 40 percent margin breaks even at 2.5x, so a 3x ROAS is genuinely profitable while a 2x is losing money before overhead. A store on a 25 percent margin needs 4x just to break even. Two stores with identical Meta numbers can be in completely different positions.
So in the report, frame ROAS against three reference points rather than a quoted figure:
- Your break-even ROAS (from your margin).
- Your goal ROAS (the target you set, which usually sits above break-even).
- Last period’s ROAS (the trend).
This keeps the report truthful and useful. If you want to work through the math in detail, see calculating break-even ROAS.
Break down where the spend went
Once the headline numbers are set, add structure so the reader can see which parts pulled their weight. Two breakdowns do most of the work for ecommerce:
- Top campaigns by spend and ROAS. Rank campaigns so the winners and the money pits are obvious. A campaign eating a third of the budget at half the average ROAS is the single most useful thing a report can surface.
- Spend pacing. Show spend to date against the period budget so nobody is surprised by where the money landed.
Demographic (age and gender) and placement breakdowns are worth including when a pattern matters. If most of the return comes from one age band or one placement, that belongs in the report because it points to the next decision. These breakdowns are also where you spot early signs of audience fatigue: rising frequency alongside a falling ROAS in a previously strong segment is a signal to refresh creative or widen targeting.
Set expectations on the numbers
A complete ecommerce report names its own limits, because the alternative is an awkward call when the totals do not match the store. Two things reliably cause a gap between Meta and your actual sales:
- Attribution timing. Meta records a purchase against the day of the ad click or view, within its attribution window. Your store records it on the order date. A purchase clicked on the 30th and ordered on the 1st lands in different periods for each system. This is not an error, just two different clocks.
- iOS and App Tracking Transparency. When users opt out of tracking, Meta cannot observe some conversions, so it tends to undercount. The effect is a directional reality to acknowledge, not a fixed percentage to quote.
A one-line note in the report (“Meta-reported purchases reflect in-platform attribution and may differ from store order totals”) prevents most confusion. For the deeper reconciliation question, the Manager vs reporting dashboard comparison explains why two views of the same account can show different ROAS.
Make it repeatable
A report you rebuild by hand each month tends to drift in layout and definitions, which makes period-over-period comparison harder than it should be. The fix is to lock the structure: same headline metrics, same formulas, same comparison window, every time. If you run more than one store or manage accounts for clients, that consistency matters even more, and a white-label version keeps each report on the right brand. The white-label client reporting guide covers that setup.
DashOps reads every Meta KPI across your ad accounts in one dashboard, with period-over-period comparison, adaptive ecommerce KPIs like ROAS and purchases, top-campaign and pacing views, and PDF, Excel, and CSV exports built in. See what each plan includes on the pricing page, and the help center covers connecting an ad account and scheduling reports.
The takeaway: build the report around ROAS, purchases, and AOV read against your own margin and last period, and the rest of the numbers fall into place as supporting detail.
Frequently asked questions
Which metrics matter most in an ecommerce Facebook Ads report?
What counts as a good ROAS for ecommerce Facebook Ads?
Why do Facebook Ads purchases not match my Shopify sales?
See it in your own dashboard
DashOps brings Meta Ads reporting, campaign management, and white-label client portals into one place. Pick the plan that fits how you run ads.