Facebook Ads Cost Per Lead Benchmark by Industry: What a Lead Should Cost in 2026
What a Facebook lead should cost in 2026
The honest answer to the Facebook Ads cost per lead benchmark question is that there is no single right number, and any source quoting one precise figure for your industry is overselling its data. Cost per lead varies widely by industry, offer, audience, objective, and season, so a CPL that is excellent for a high-value B2B service would be alarming for a low-ticket local promotion. Instead of chasing an average cost per lead Facebook publishes nowhere reliably, the better move is to learn the formula, understand what drives the number, and benchmark your own account against its own history. That is the only comparison that reflects your actual economics.
The cost per lead formula
Cost per lead is simple arithmetic, and getting it right starts with a clean definition.
- The formula. Cost per lead = spend / leads, measured over the same date range.
- Match the windows. Spend and lead counts must cover the identical period, or the ratio is meaningless.
- Define a lead once. Decide whether a lead is every Instant Form submission or only a qualified one, then keep that definition consistent across reports.
For Meta lead gen, a “lead” usually means a completed Meta Instant Forms submission. That is a clean event to count, which is part of why Instant Forms cost per lead is easier to track than off-platform form fills that depend on landing pages and pixel firing.
Why a single CPL benchmark by industry misleads
A CPL benchmark by industry feels useful because it promises a target to hit. In practice, the spread inside any one industry is enormous, so the median tells you very little about whether your specific campaign is doing well.
Several factors move cost per lead, and none of them are captured by an industry label alone:
- Auction demand. More advertisers competing for the same audience pushes costs up, and demand spikes around seasonal events and holidays.
- Audience and targeting. Broad, cold audiences usually cost differently than warm retargeting pools.
- Objective and optimization. Optimizing for leads, conversions, or form opens produces different CPLs for the same budget.
- Offer and friction. A free guide collects cheaper leads than a request for a sales call, but the cheaper leads are often worth less.
- Creative quality. Stronger creative lifts click-through and lowers cost; tired creative does the opposite.
This is why a Meta lead gen benchmark borrowed from a blog post can send you chasing the wrong target. Two accounts in the same industry, running different offers to different audiences, will land in completely different places and both can be healthy.
Benchmark against yourself, not an average
The most reliable benchmark you have is your own account over time. Period-over-period comparison answers the question that actually matters: is this period’s cost per lead better or worse than last period’s, and what changed.
- Trend beats absolute. A CPL trending down month over month is good news even if it sits above some external figure.
- Segment before you judge. Compare like with like: the same campaign, audience, and offer across periods, not your whole account blended together.
- Watch lead volume alongside cost. A falling CPL paired with falling lead volume can mean you narrowed too far, not that you improved.
Tracking the direction of your own numbers is the practical version of benchmarking. For a wider view of which metrics to watch beyond CPL, see the Meta ad KPIs to track, and to put CPL in context with adjacent efficiency metrics, ROAS vs CPL vs CPA explained covers how they relate.
Tie cost per lead to lead value
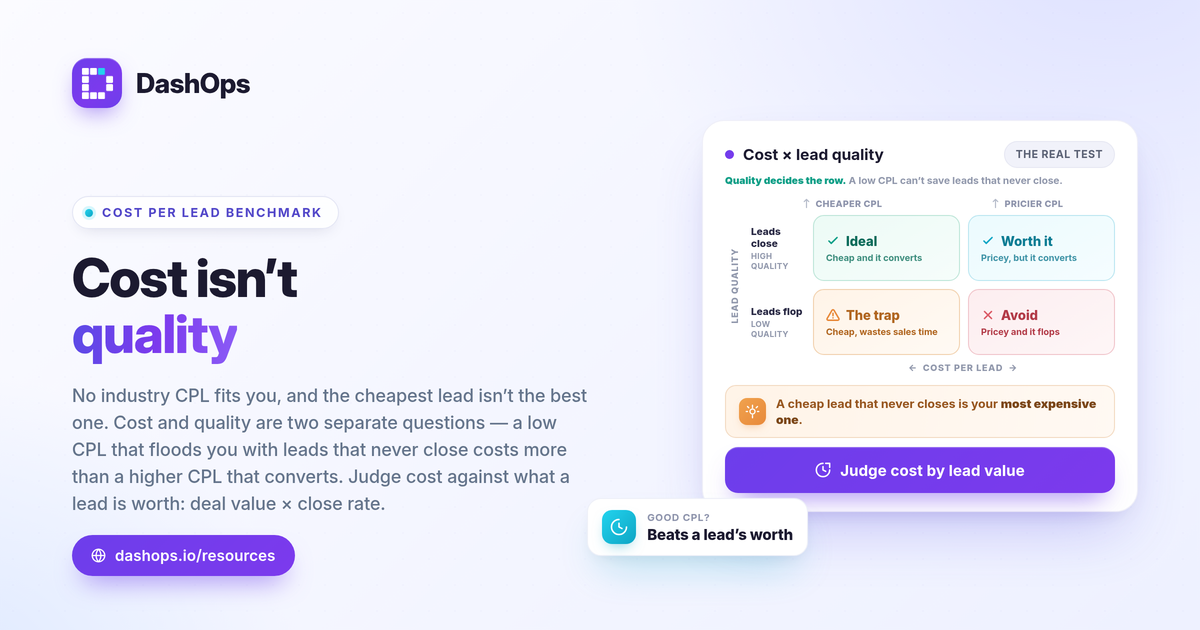
A low cost per lead is only good if the leads are worth more than they cost. The number that decides whether your CPL is acceptable is the value of a lead to your business.
Work backward from your economics:
- Estimate lead value. Average deal value times your close rate gives the revenue a lead is worth on average.
- Set a ceiling. Your acceptable CPL is whatever keeps you profitable after delivery costs and margin.
- Compare cost to quality. Two campaigns with identical CPL can perform very differently once you look at which one produces leads that close.
This is where cheap leads can be expensive. A campaign that floods you with low-intent form fills at a low CPL can cost more in wasted sales time than a campaign with a higher CPL and better-qualified leads. Cost per lead and lead quality are two separate questions, and you need both to judge performance.
Counting leads accurately
A benchmark is only as good as the lead count behind it, and two things commonly distort that count.
- iOS and ATT undercounting. After Apple’s tracking prompt changes, some conversions go unattributed, which can make reported lead numbers look lower than reality. Native Instant Form submissions are more resilient because the event happens inside Meta, but off-platform conversions are more exposed.
- The 90-day lead window. Meta only lets you download Instant Form leads directly from the Page for a limited window of about 90 days. After that, leads must be retrieved through the API or a connected tool. If you rely on manual Page downloads, you can lose older leads and skew any historical CPL comparison.
The fix is to export leads on a regular schedule rather than waiting, and to keep your lead history somewhere you control. A connected reporting layer that reads Instant Forms and lets you export leads to CSV or Excel removes the 90-day cliff from your workflow.
Putting it into a report
Once you have a clean CPL and a consistent definition, the reporting job is to show cost, volume, and trend together so a reader can see whether the money worked. DashOps reads your Meta lead gen KPIs, including spend, leads, and cost per lead, across one or more ad accounts in a single dashboard with period-over-period comparison built in, captures Instant Forms leads, and exports them to CSV or Excel so you are not stuck inside the 90-day Page limit. See what each plan includes on the pricing page, and the help center walks through connecting an ad account. If you report to clients, white-label client reporting keeps the CPL story on your own brand, covered in white-label client reporting.
The practical takeaway: stop hunting for one universal Facebook Ads cost per lead number and start tracking your own CPL trend against your lead value, because that comparison is the only one that tells you the truth about your account.
Frequently asked questions
What is a good cost per lead on Facebook Ads?
How do I calculate cost per lead from Facebook Ads?
Why do my Facebook CPL benchmarks differ from what I read online?
See it in your own dashboard
DashOps brings Meta Ads reporting, campaign management, and white-label client portals into one place. Pick the plan that fits how you run ads.