Supermetrics Alternative for Meta Ads: Skip the Spreadsheet Pipeline with a Ready Dashboard
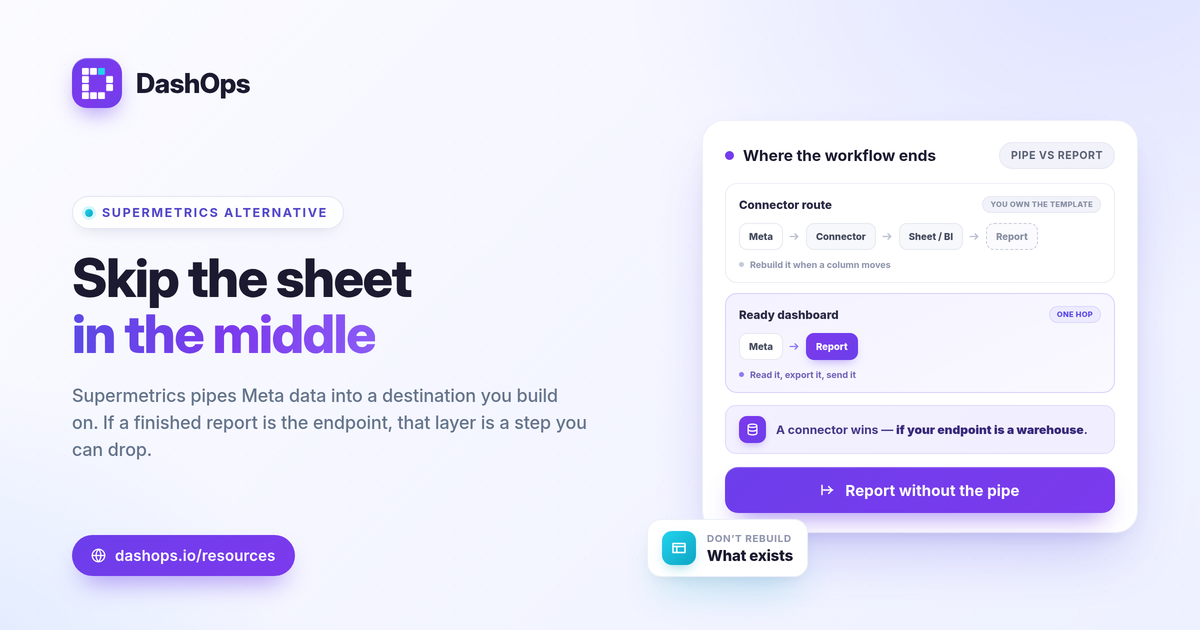
If you want a Supermetrics alternative for Meta Ads, the real question is what sits at the end of your workflow: a finished report, or a custom data destination you build yourself. Supermetrics is a data connector. Its model is to pipe Meta numbers into a spreadsheet, Looker Studio, or a warehouse, where you then build the report. DashOps takes the opposite approach: a ready Meta Ads dashboard that reads your Facebook and Instagram ad accounts directly and shows results, with no Sheets or BI layer to assemble first. If your goal is to read and report on Meta performance quickly, the turnkey dashboard removes a whole step.
The core difference: a data pipe vs a ready dashboard
Supermetrics and DashOps solve the same starting problem, getting Meta Ads data out of Ads Manager, but they hand you different things at the finish line.
- Supermetrics is a connector. It pulls Meta data into a destination you choose: Google Sheets, Excel, Looker Studio, BigQuery, and other tools. You then build the layout, the formulas, and the charts. The strength is flexibility across many channels and destinations. The cost is that someone has to build and maintain the report.
- DashOps is the report. It connects to your Meta ad accounts and renders the dashboard for you: spend, impressions, reach, clicks, CPC, CPM, CTR, ROAS, purchases, leads, cost per lead, and more, with period-over-period comparison and trend charts already in place. There is no query to write, no Sheet to wire up, no BI template to maintain.
Neither model is wrong. The right one depends on whether you want to assemble data or read it.
When the spreadsheet pipeline is the wrong tool
The pipe-into-a-spreadsheet model earns its keep when you are blending many data sources into a custom view, or feeding a warehouse for analysts. For a lot of people running Meta Ads, though, that machinery is overhead they never asked for.
- You only run Meta Ads. If Facebook and Instagram are your whole world, piping that data into Sheets just to rebuild a dashboard you could have read directly is wasted effort.
- Reports break when a column moves. A spreadsheet report is only as stable as its formulas. Rename a field, shift a range, or change a tab and the report silently goes wrong.
- Maintenance never ends. Someone owns the template. When Meta changes a field or a client wants a new metric, that person rebuilds it.
- Onboarding is slow. A new team member has to learn your spreadsheet conventions before they can trust the numbers.
If any of those describe you, a Meta Ads dashboard without spreadsheets is the simpler path.
Where a connector still wins
To be fair, there are real cases where a connector like Supermetrics is the better fit, and a Meta-only dashboard is not:
- Many channels in one custom view. If you need Meta alongside Google Ads, TikTok, email, and organic in a single blended sheet or warehouse table, a multi-source connector is built for that.
- A data warehouse or BI practice. If analysts query your data in BigQuery or model it in Looker Studio, you need the raw pipe, not a finished dashboard.
- Bespoke calculations. If your reporting depends on custom formulas that only live in your spreadsheets, you want the data delivered there.
DashOps does not try to be a cross-channel warehouse connector. It is a Meta-specialized dashboard. If your endpoint is a finished Meta report rather than a custom data layer, that focus is the advantage.
Supermetrics vs DashOps: a capability and approach comparison
This compares how each tool is positioned and how it works, not specific prices or limits. Always check each vendor’s current pricing page for exact, up-to-date figures.
| Capability or approach | Supermetrics | DashOps |
|---|---|---|
| Core model | Data connector into a destination | Ready Meta Ads dashboard |
| Channels | Many (cross-channel) | Meta (Facebook and Instagram) focused |
| Where you read results | Sheets, Looker Studio, Excel, warehouse | Built-in dashboard, no extra layer |
| Setup before first report | Build the query and the report | Connect ad accounts, results render |
| Report maintenance | You own the template | Dashboard is maintained for you |
| Exports | Depends on your destination | Native PDF, Excel, CSV |
| Client reports | Build in your BI tool | White-label reports and client portal |
| Pricing approach | Check vendor page | Per ad account, see pricing |
What you read in a ready Meta dashboard
The point of skipping the pipeline is that the analysis is waiting for you. With DashOps connected to your Meta ad accounts, you open the dashboard and see:
- 17+ Meta KPIs with period-over-period comparison, so you can tell whether this period beat the last one at a glance. For how to judge whether a number is actually good, compare it against your own goals, your margin, and your prior-period trend rather than chasing a universal benchmark.
- Trend charts that show the shape of spend and results over time, not just the totals.
- Demographic and placement breakdowns so you can see which ages, genders, and placements are carrying the account, and where budget is being wasted.
- Adaptive KPIs that shift between lead-gen and e-commerce framing, surfacing cost per lead and leads for lead accounts or ROAS and purchases for sales accounts.
- Multiple ad accounts in one place, which matters if you manage several. There is more on that in managing multiple Meta ad accounts.
The formulas behind these are the standard ones, and you do not have to write them: CTR = clicks / impressions, CPC = spend / clicks, CPM = spend / impressions times 1000, ROAS = conversion value / spend, and cost per lead = spend / leads. The dashboard computes them; you read them.
Exports and client reporting without the middle layer
A connector hands you data and leaves the report to you. A ready dashboard produces the deliverable. DashOps exports to PDF, Excel, and CSV directly, sends scheduled email digests, and produces white-label client reports and public read-only share links. For agencies and freelancers, that means a polished client report without rebuilding a template every month. If client work is your reason for reporting at all, white-label client reporting covers how that side works.
One platform fact worth keeping in mind for lead-gen exports: Meta only lets you download Instant Form leads directly from the Page for a limited window, about 90 days, after which leads must be retrieved via the API or a connected tool. A dashboard that captures leads on an ongoing basis keeps that history available instead of letting it age out of reach.
Choosing between them
The decision comes down to one question. If your reporting ends in a custom data layer that you control, a connector like Supermetrics fits the workflow. If your reporting ends in a Meta Ads report you read and send, a ready dashboard removes the spreadsheet pipeline entirely. Many people reach for a connector by default and only later realize they were rebuilding a dashboard that already exists.
DashOps is the second option: a Meta-specialized dashboard with per-ad-account pricing, native PDF, Excel, and CSV exports, and white-label tiers, so you read Facebook and Instagram results without a Sheets or BI step in between. You can see what each plan includes on the pricing page, and the help center walks through connecting your ad accounts. If you also want to see how a dashboard compares to working straight out of Ads Manager, Facebook Ads Manager vs a reporting dashboard covers that ground.
The practical takeaway: choose a connector when your endpoint is a custom data destination, and choose a ready dashboard when your endpoint is a Meta Ads report you actually want to read.
Frequently asked questions
Is a Meta Ads dashboard a true Supermetrics alternative?
Do I still need Google Sheets or Looker Studio with a ready dashboard?
Can I export Meta Ads reports without a spreadsheet pipeline?
See it in your own dashboard
DashOps brings Meta Ads reporting, campaign management, and white-label client portals into one place. Pick the plan that fits how you run ads.