Monthly Meta Ads Report Template: What to Include and a Free Download
A monthly Meta Ads report template should answer one question for whoever opens it: did the money work last month, and what changed. The strongest monthly Meta Ads report template covers six sections in order: headline numbers, period-over-period comparison, trend, top campaigns, one audience or placement breakdown, and a short written takeaway. Below is the exact structure to use, what belongs in each section, a free template you can copy, and an automated alternative for when copying numbers by hand stops being worth the time. The same outline works for a monthly Facebook Ads report whether you sell products or generate leads.
Section 1: Headline numbers tied to the goal
Open with the metrics that map to the objective, not every figure Meta returns. A reader should grasp the outcome in the first few seconds.
- Spend and results. What you spent and what you got, side by side.
- Efficiency. Cost per result, which is cost per purchase for e-commerce or cost per lead for lead gen.
- Return. ROAS for sales (ROAS = conversion value / spend) or pipeline value for lead gen.
Keep the formulas visible if your reader is non-technical: CPC = spend / clicks, CPM = spend / impressions times 1000, cost per lead = spend / leads. For a fuller list of what is worth tracking, see Meta Ads KPIs to track.
Section 2: Period-over-period comparison
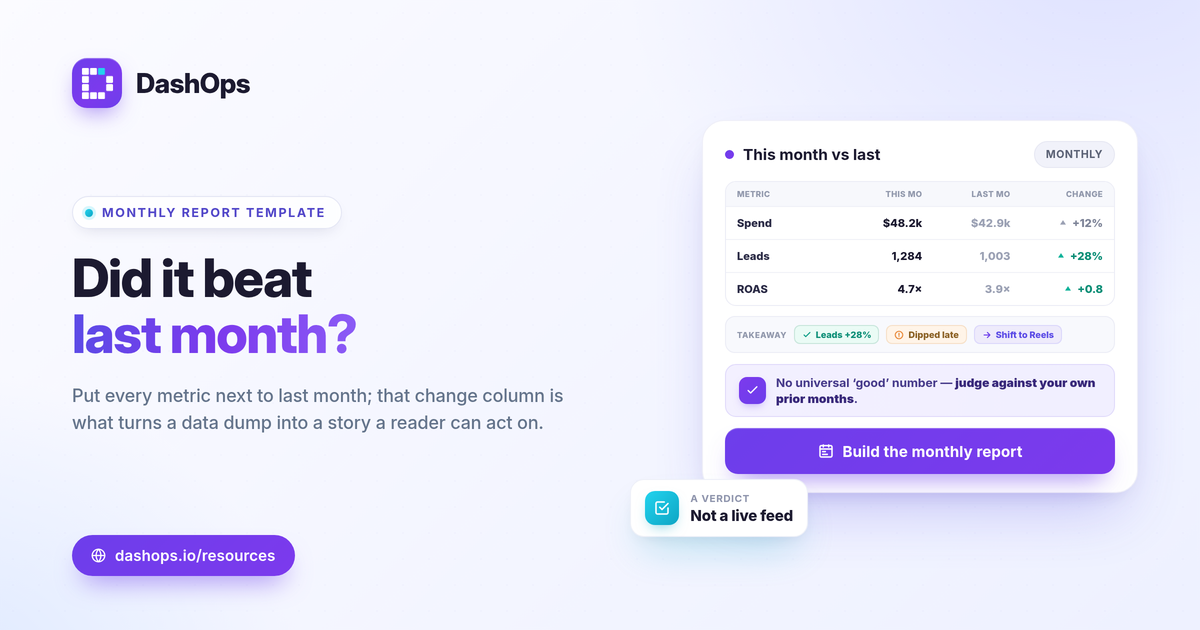
This is the section that turns a data dump into a report. A single total tells the reader nothing about direction. The same number next to last month tells them everything.
For each headline metric, show three columns: this month, last month, and the change. The change is what the reader actually wants. A flat ROAS with rising spend is a different story than a flat ROAS with falling spend, and only the comparison reveals it. If you report on a calendar month, compare to the previous calendar month so the windows match.
Section 3: The trend, not just the total
A month is long enough to hide a mid-month shift. A simple trend line for spend and your main efficiency metric shows whether performance held steady, climbed, or slid toward month end.
This is also where you can flag early fatigue. If frequency rose across the month while CTR softened, the trend makes that visible before it shows up as a worse cost per result. You do not need creative-level analysis to spot it: frequency as a KPI plus the efficiency trend is enough to raise the question.
Section 4: Top campaigns
Most accounts concentrate spend and results in a handful of campaigns. List the top campaigns by spend, with results and cost per result next to each.
- Where the money went. The campaigns carrying most of the budget.
- What it returned. Results and efficiency per campaign, so winners and laggards are obvious.
- One line of context. A note on anything you changed during the month, like a budget shift or a new audience.
This keeps the report honest. It shows the reader that the account was managed, not left on autopilot.
Section 5: One breakdown that explains the result
Add a single breakdown that answers a question the headline numbers raised. Pick one, do not paste all of them.
- Demographic breakdown. Age and gender, useful when one segment is clearly cheaper or more valuable.
- Placement breakdown. Feed, Stories, Reels and the rest, useful when spend is pooling in a placement that underperforms.
A monthly Meta Ads report example that includes one well-chosen breakdown reads as analysis. One that includes six reads as a screenshot dump. The job here is to explain a result, not to show every cut of the data.
Section 6: A short written takeaway
End with two or three sentences in plain language: what happened, why, and what you will do next month. This is the part most reports skip and the part most readers remember.
A useful pattern is one win, one concern, one action. For example: spend held steady while cost per lead improved, lead volume dipped in the final week, and next month you will shift budget toward the placement that produced the cheapest results. No jargon, no hedging.
How to judge whether the month was good
Avoid anchoring to a universal benchmark. A “good” ROAS or cost per result depends on your margin, your goals, and your own prior months. Judge against three references instead:
- Your goal. The target you set before the month started.
- Your margin. For e-commerce, break-even ROAS = 1 / profit margin tells you the floor you must clear.
- Your trend. Last month and the months before, which the comparison section already surfaces.
If you report for clients or sell on outcomes, this framing also protects you from a number that looks fine in isolation but is sliding month over month.
A free monthly Meta Ads report template
You can build this template once and reuse it. In a spreadsheet, create one tab per section above: a headline summary with the three-column comparison, a small trend chart, a top-campaigns table, and a breakdown table. Add a text box at the top for the written takeaway. Export to PDF when you send it.
This works, and for a single account it is often enough. The cost shows up at scale. Every month you export the raw numbers from Meta, paste them in, rebuild the comparison columns, and refresh the charts. With several ad accounts that manual cycle eats hours, and a single paste error quietly undermines trust in the whole document. If you are weighing the manual route against a dedicated tool, the Ads Manager vs reporting dashboard comparison lays out the tradeoff.
The automated alternative
The structure above does not change when you automate it. The manual export and paste step does. A connected dashboard reads every KPI across your ad accounts, calculates period-over-period changes for you, and renders the trend, top campaigns, and breakdowns without copy and paste.
DashOps follows exactly this monthly structure: headline KPIs with period-over-period comparison, trend charts, top campaigns, spend pacing, and demographic and placement breakdowns, all in one dashboard. You can export it as a PDF or Excel file, schedule it as a monthly email digest, or send a read-only share link, and on Growth and Enterprise the reports can be white-labeled for clients. See what each plan includes on the pricing page, and the help center covers setup. If your monthly report goes to clients, the white-label client reporting guide covers presenting it under your own brand.
The practical takeaway: build the six sections once, lead every metric with its month-over-month change, and let a tool handle the repeat export so the report stays consistent month after month.
Frequently asked questions
What should a monthly Meta Ads report include?
How is a monthly Facebook Ads report different from a weekly one?
Can I automate my monthly Meta Ads report instead of using a template?
See it in your own dashboard
DashOps brings Meta Ads reporting, campaign management, and white-label client portals into one place. Pick the plan that fits how you run ads.