How to Compare This Month's Facebook Ads Performance to Last Month
A month-over-month comparison answers one question: did this month beat last month, and what changed. To compare Facebook Ads month over month, set two equal date ranges, this month and the prior month, and read the same metrics side by side so every number carries a direction, not just a value. The goal is not a wall of figures. It is a clear verdict on whether your spend worked harder or softer than before, and which lever moved it. Done well, period-over-period Meta ads reporting turns a static snapshot into a story anyone reading the report can follow.
Set two equal, comparable date ranges
The comparison only holds if the two periods are the same length and the same shape.
- Match the length. Compare a full calendar month to the full prior month. A 30-day period against a 31-day one already tilts the result before you read a single metric.
- Match the position if you are mid-month. On the 15th, compare the first 15 days of this month to the first 15 days of last month, not against a complete previous month. Otherwise the current month always looks behind.
- Watch seasonality. A month with a holiday weekend or a promotion is not a fair baseline for a quiet month. Note the context in the report so the reader does not misread a swing.
Equal ranges are what make a Facebook Ads trend comparison trustworthy. Unequal ranges produce changes that are real arithmetic but tell you nothing about performance.
Let the recent days settle first
Meta attributes some conversions back to the day the click or view happened, so the last several days of any period keep filling in after they pass. If you pull the report the morning the month ends, the newest days are still incomplete and the current month will read low.
There is a second effect worth naming. iOS and App Tracking Transparency cause some conversions to be undercounted or modeled rather than fully observed, so reported results can sit below what actually occurred. Neither effect has a single fixed number you can apply. The practical move is to wait a few days after the period closes before treating totals as final, and to compare like with like: a settled month against a settled month.
Lead with the metrics tied to the goal
Open the comparison with the numbers that map to what the spend was for, then add the efficiency metrics that explain the movement.
- Spend and results. What you spent each month and what you got, side by side. This is the headline.
- Cost per result. Cost per purchase or cost per lead, calculated as spend divided by results. This is whether the money worked harder or softer.
- Return. ROAS for sales, which is conversion value divided by spend, or pipeline value for lead gen.
- The why metrics. CPC, CPM, and CTR explain the headline. CTR is clicks divided by impressions, CPC is spend divided by clicks, and CPM is spend divided by impressions times 1000. If cost per result rose, these usually show where.
For a fuller list of what each metric means and when it matters, see the guide on Meta ads KPIs to track.
Read the direction, then find the cause
A month-over-month figure has two parts: the size of the change and the reason behind it. Stopping at the first is where most reports go wrong.
- Did efficiency change or did volume change. Spend up and results up at the same cost per result is just scale. Cost per result up at flat spend is a problem to investigate.
- Trace it down the funnel. A higher cost per result with a falling CTR points at the creative or audience. A steady CTR with a rising CPM points at auction pressure or rising frequency, not your ad.
- Check for fatigue. If frequency climbed and CTR slipped over the month, the audience may be seeing the same ads too often. Demographic and placement breakdowns show whether a specific age, gender, or placement is dragging the average.
This is the difference between reporting a number and explaining it. The reader wants the second.
Decide what counts as good for you
There is no universal benchmark that tells you whether a month-over-month change is good. The same percentage change means something different for a high-margin product than a thin-margin one, so judge each change against three things you control.
- Your goal. If the target was lower cost per lead, did cost per lead fall, regardless of what other metrics did.
- Your margin. For sales, compare ROAS to your break-even ROAS, which is 1 divided by your profit margin. Above it you made money, below it you did not.
- Your own trend. Two months rarely tell the full story. A single dip inside a rising three-month line is noise. The same dip inside a falling line is a signal.
Make the comparison repeatable
The first month-over-month report is work. Every one after that should be the same template with new dates, so the structure stays constant and only the numbers change. Consistency is what lets a reader compare March to February to January without relearning the layout each time. If you are deciding how often to run it, the post on weekly vs monthly Meta ads reports covers the trade-off.
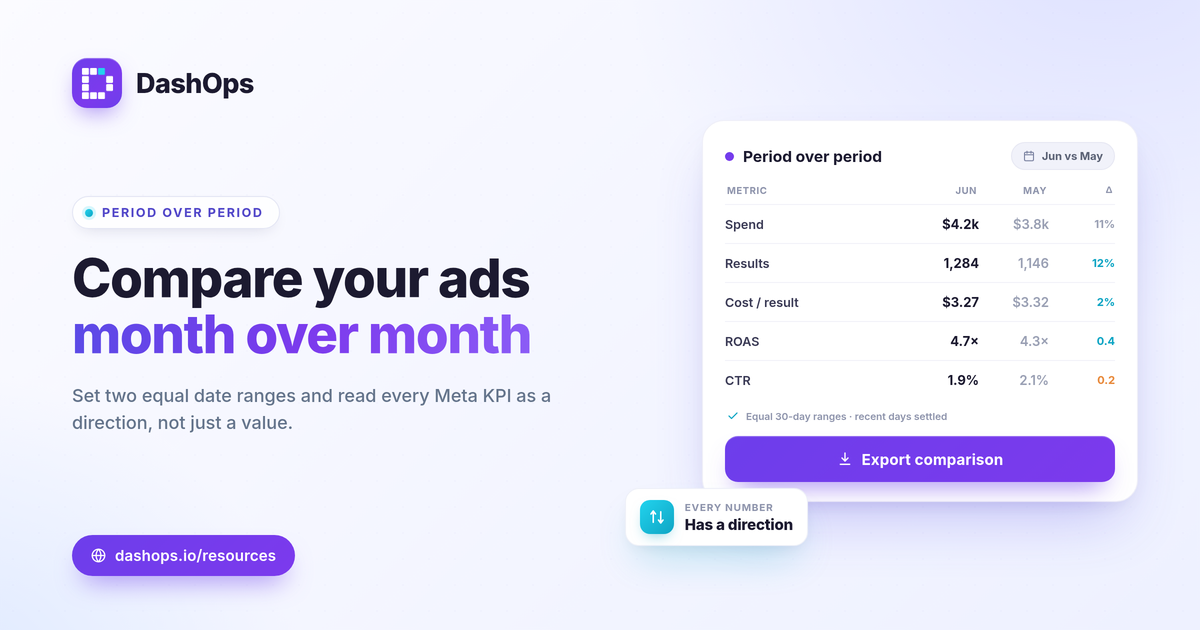
Pulling two date ranges and lining up every KPI by hand is the slow part, especially across more than one ad account. DashOps has period-over-period comparison built into the dashboard: pick a date range and it shows each of 17+ Meta KPIs against the prior period, with trend charts and demographic and placement breakdowns, then exports the same view to PDF, Excel, or CSV. See what each plan includes on the pricing page, and the help center walks through connecting your ad accounts.
The takeaway: set two equal date ranges, let the recent days settle, and report every metric as a direction so the reader always knows whether the month improved.
Frequently asked questions
What date ranges should I use to compare Facebook Ads month over month?
Why do my Facebook Ads numbers change after the month ends?
Which metrics matter most when comparing two months?
See it in your own dashboard
DashOps brings Meta Ads reporting, campaign management, and white-label client portals into one place. Pick the plan that fits how you run ads.