Meta-Native ROAS vs Blended ROAS: What the Difference Means for Your Reports
Meta-native ROAS and blended ROAS measure two different things, and confusing them is one of the most common reasons reports get questioned. Meta-native ROAS is the return Meta attributes to its own ads, calculated as conversion value divided by spend within Meta’s attribution window. Blended ROAS is your total revenue divided by your total ad spend across every channel. Meta-native ROAS usually reads higher, blended ROAS usually reads lower, and both can be true at once. The point of this post is to explain why they diverge so you can read each number honestly and report it without overclaiming.
What Meta-native ROAS actually measures
Meta-native ROAS is the figure that appears inside Meta Ads Manager and inside a dashboard that reads Meta’s API. The formula is simple:
- ROAS = conversion value / spend. If Meta records 4,000 in purchase value against 1,000 in spend, that is a 4.0 ROAS.
The important part is the word Meta. This number reflects only the conversions Meta can see and chooses to credit, based on the attribution setting and windows you have selected (for example, 7-day click). It does not know about a sale that came from an email, a returning customer who typed your URL directly, or a purchase made offline. It reports Meta’s view of Meta’s contribution, nothing more.
That is a strength when you are optimizing inside the platform. To decide which campaign to scale, you want Meta’s own signal, because that is the lever the algorithm pulls.
What blended ROAS measures, and why it differs
Blended ROAS explained in one line: it is the whole account’s efficiency. You take all the revenue your business earned in a period and divide it by everything you spent on ads.
- Blended ROAS = total revenue / total ad spend. Total revenue usually comes from your store platform or analytics, not from any single ad channel.
Because the numerator includes sales from every source (organic, email, direct, other channels) and the denominator includes all paid spend, blended ROAS smooths out the credit that any one platform claims for itself. This is the platform ROAS vs blended ROAS distinction in practice: platform ROAS is one channel’s self-reported credit, blended ROAS is the business-level result.
The two numbers diverge for a few structural reasons:
- Overlapping credit. Meta may claim a conversion that email or search also influenced. Blended counts that sale once at the business level.
- Attribution windows. Meta credits clicks and views inside a set window. A purchase that happened later, or that Meta never saw, still shows up in your total revenue but not in Meta’s ROAS.
- iOS and privacy signal loss. Since the App Tracking Transparency changes, Meta cannot observe every conversion it drove. This causes undercounting in Meta-native ROAS, which can make blended look weaker than Meta by comparison or, in other accounts, hides Meta’s true contribution. The direction depends on your mix.
A quick comparison
| Question | Meta-native ROAS | Blended ROAS |
|---|---|---|
| What it divides | Meta conversion value / Meta spend | All revenue / all ad spend |
| Whose view | Meta’s attribution | Your business as a whole |
| Best used for | Optimizing campaigns inside Meta | Judging total account profitability |
| Where the data lives | Meta API and your dashboard | Store or analytics plus all ad platforms |
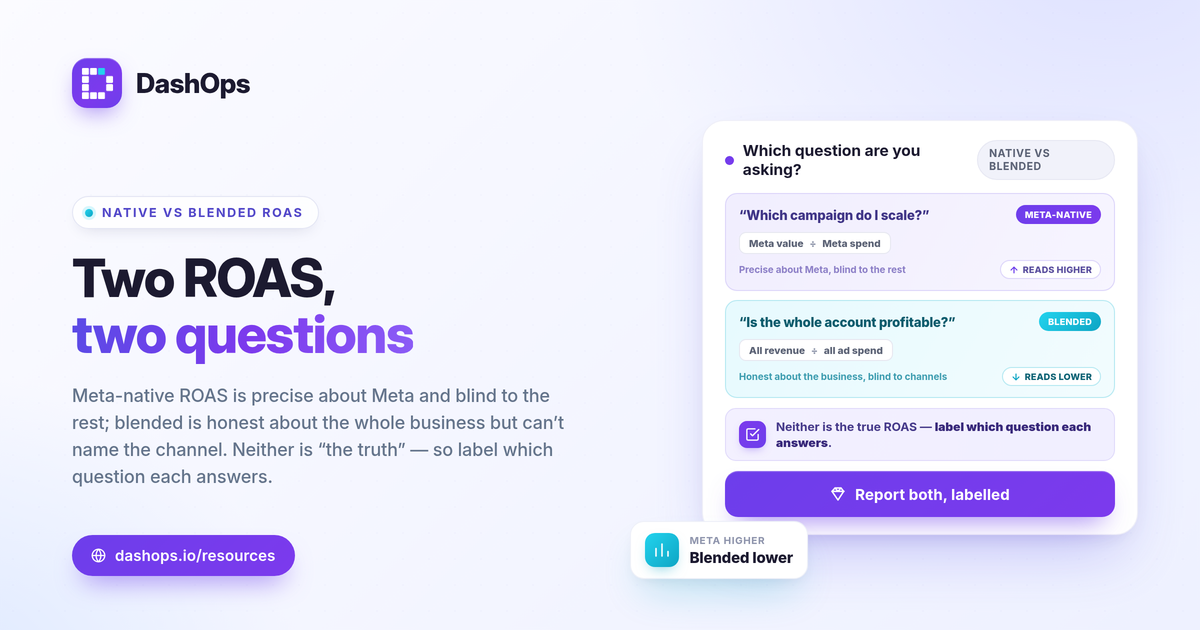
Neither column is the true ROAS e-commerce operators sometimes ask for. The honest answer is that no single tool sees everything. Meta-native is precise about Meta and blind to the rest. Blended is honest about the business and cannot tell you which channel did the work.
How DashOps reports ROAS, and what it does not claim
DashOps reads Meta-native numbers directly from the Meta API. The ROAS, purchases, and conversion value you see are what Meta attributes to your ads, shown with period-over-period comparison and trend charts so you can see whether return is improving against your prior period. That is the right scope for a Meta reporting dashboard, and it is the same data you would see in Ads Manager, organized for reporting.
What DashOps does not do is just as important to state clearly:
- It does not blend. DashOps does not pull your store’s total revenue or other ad channels into a single combined ROAS. It reports the Meta module faithfully.
- It does not invent server-side attribution. DashOps reads Meta-native figures. It does not model conversions, apply a custom attribution layer, or claim to recover the sales Meta lost to privacy changes. Meta attribution reporting in DashOps means showing Meta’s numbers accurately, not reinterpreting them.
To build a blended view, the practical workflow is to take the Meta-native ROAS from DashOps and combine it with revenue from your store or analytics platform in your own report. DashOps gives you the clean, exportable Meta half of that equation.
How to read the two numbers together
You do not have to pick one. Use each for its job:
- Optimize with Meta-native. When deciding which campaign or audience to scale, trust Meta’s signal, because that is what the algorithm responds to. Pair it with the other Meta ads KPIs to track so a single ratio does not drive every decision.
- Judge health with blended. When asking whether the account is actually profitable this month, look at blended ROAS against your margin. A useful guardrail is break-even ROAS, which is 1 divided by your profit margin. Anything above that is contributing profit.
- Explain the gap, do not hide it. If a client or stakeholder asks why Meta reports a higher ROAS than the bank account suggests, the answer is attribution overlap and privacy-driven undercounting, not a broken report. For a deeper version of that conversation, see why Facebook ads reports show different ROAS.
The goal is not to reconcile the two numbers into one. It is to know which question each one answers and to label it that way in every report.
If you report on Meta and want the platform half done cleanly, DashOps pulls every Meta KPI, including Meta-native ROAS, into one dashboard with period-over-period comparison and PDF, Excel, and CSV exports, all without overclaiming attribution it cannot see. See what each plan includes on the pricing page, and the help center walks through connecting an account. If you compare tooling, the difference from raw exports is covered in Facebook Ads Manager vs a reporting dashboard.
The takeaway: label every ROAS in your report as Meta-native or blended, because the number means nothing until the reader knows which question it answers.
Frequently asked questions
Is Meta-native ROAS or blended ROAS the correct number?
Why is my Meta-native ROAS higher than my blended ROAS?
Does DashOps calculate blended ROAS?
See it in your own dashboard
DashOps brings Meta Ads reporting, campaign management, and white-label client portals into one place. Pick the plan that fits how you run ads.