Meta Ads Client Report Template: A White-Label Format for Reporting to Clients
A good Meta Ads client report template answers one question on the first page: did the budget work, and what changed since last time. Everything after that is supporting detail. The format below is a clean, repeatable structure you can brand as your own, built around the KPIs clients actually understand and ending with a white-label export path so the finished report carries your name, not a third-party tool’s. Use the same Facebook Ads client report template every period so the client learns where to look, and let a period-over-period comparison do the heavy lifting of telling the story.
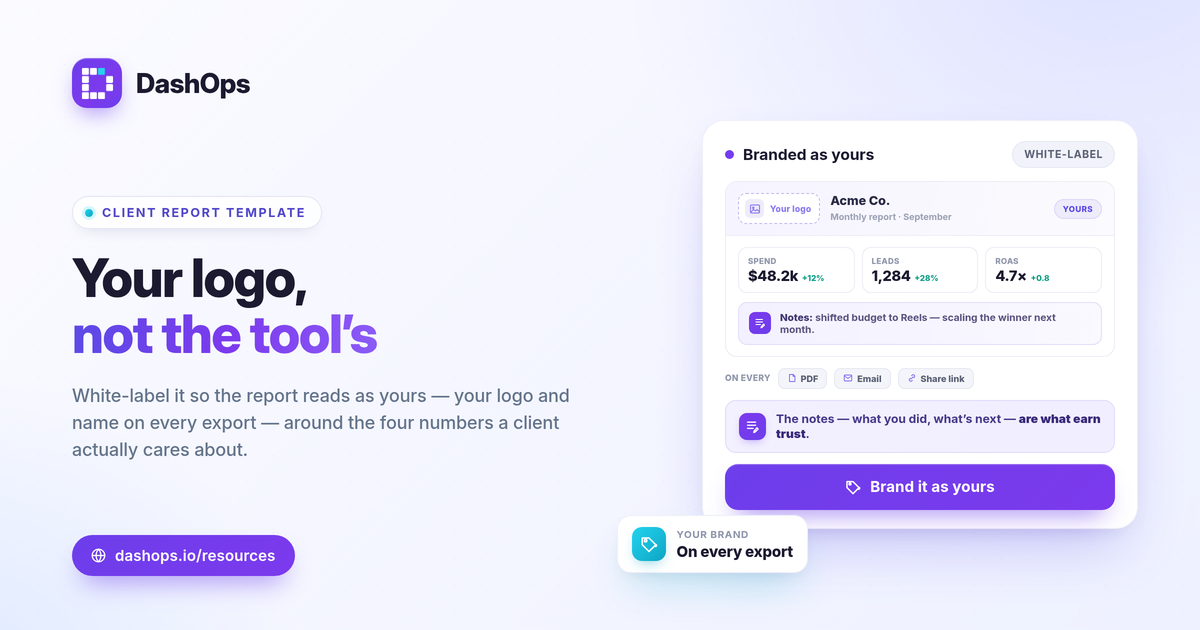
Open with the headline the client cares about
The first section should be readable in ten seconds. Lead with the numbers tied to the goal, not every figure Meta returns.
- Spend and results. What you spent and what it produced, side by side.
- Efficiency. Cost per result, whether that is cost per purchase or cost per lead.
- Return. ROAS for e-commerce, or cost per lead and pipeline value for lead gen.
- Change. How each of the above moved versus the prior period.
This is the whole report in miniature. A client who reads only this section should still walk away knowing whether the money worked.
Use the KPIs clients understand
Clients do not need all 17-plus Meta metrics. They need the handful that map to their business. Pick the row that fits the account and stay consistent.
For e-commerce, the core set is spend, purchases, purchase value, and ROAS, with cost per purchase and average order value as support. The formula clients can hold onto is ROAS = conversion value / spend, so a value above your break-even ROAS (1 / profit margin) means the account is profitable, not just busy.
For lead gen, the core set is spend, leads, and cost per lead, where cost per lead = spend / leads. DashOps adapts its KPIs to the account type automatically, so a lead-gen client sees lead metrics and an e-commerce client sees purchase metrics without you rebuilding the layout. If you want a deeper breakdown of which metrics belong in the report, the guide on Meta Ads KPIs to track covers each one.
Show the trend, not just the total
A single month’s number hides the story. A period-over-period comparison shows whether this period beat the last, which is the question every client has whether they say it or not.
- Direction. Is cost per result rising or falling across periods.
- Context. A short trend chart for spend, results, and efficiency over time.
- Honesty. If a number got worse, show it and explain why. Frequency creeping up, a seasonal dip, or a placement that stopped working are all legitimate, explainable causes.
Trends also let you discuss ad fatigue without guesswork. Rising frequency alongside a climbing cost per result, visible in the period-over-period view, is the pattern worth flagging before the client asks.
Add the breakdowns that explain the result
Headline numbers say what happened. Breakdowns say why, and they are what make a report feel like analysis rather than a screenshot.
- Top campaigns. Where the budget went and what each campaign returned.
- Demographics. Age and gender breakdowns showing which audiences responded.
- Placement. Which placements earned their spend and which did not.
- Spend pacing. Whether the account is tracking to budget for the period.
Keep this section tight. Two or three breakdowns that actually changed a decision beat a wall of tables nobody reads.
A clean client report template structure
Here is the full layout in order. Copy it once and reuse it every period.
| Section | What it shows | Why it is there |
|---|---|---|
| Summary | Spend, results, cost per result, return, change vs last period | The whole report in one glance |
| Trend | Spend and efficiency over time | Direction, not just totals |
| Top campaigns | Best and worst performers by spend and return | Where the money worked |
| Breakdowns | Demographics, placement, pacing | Why the result happened |
| Notes | What you did and what is next | Turns data into a plan |
The Notes section is the one most templates skip and the one clients value most. Two or three plain sentences on what you changed and what you plan next is the difference between a data dump and a report someone trusts.
Make it white-label so it reads as yours
A white-label Meta Ads report carries your branding, not the reporting tool’s. That means your logo, your colors, and your sender details on every PDF, email digest, and share link. For a fuller walkthrough of branding and client access, see white-label client reporting.
This is also where a dedicated dashboard earns its place over the native interface. Ads Manager is built for operating an account, not presenting one, and its exports look like the platform, not like you. The comparison in Ads Manager vs a reporting dashboard covers that gap in detail.
Export and deliver it
Once the template is set, delivery should be the easy part. A solid client ad reporting template supports more than one format:
- PDF for the branded monthly summary clients file and forward.
- Excel or CSV for clients who want to slice the raw numbers themselves.
- A read-only share link or client portal for clients who prefer a live view between reports.
- Scheduled email digests so the report arrives on the same day each period without manual sending.
Pick the channel that fits the client and keep it consistent, the same way you keep the template consistent.
Where DashOps fits
DashOps reads every Meta KPI across your ad accounts into one dashboard with period-over-period comparison, demographic and placement breakdowns, and top campaigns built in, then exports it all as PDF, Excel, or CSV. White-label Lite comes with Growth and white-label Full with custom domains comes with Enterprise, so the finished report and the client portal carry your brand. See what each plan includes on the pricing page, and the help center walks through connecting an account and setting up scheduled digests.
The practical takeaway: build the template once around the four headline numbers and a period-over-period comparison, brand it as your own, and reuse the exact same format every period so the trend tells the story for you.
Frequently asked questions
What should a Meta Ads client report include?
How do I make a Facebook Ads client report look white-label?
How often should I send a client ad report?
See it in your own dashboard
DashOps brings Meta Ads reporting, campaign management, and white-label client portals into one place. Pick the plan that fits how you run ads.