Meta Ads Benchmarks for Lead Generation: Cost Per Lead and CTR by Industry
Meta Ads benchmarks for lead generation are most useful when you stop chasing a single universal number and start measuring against your own goals, margin, and prior periods. For service and B2B businesses, the three metrics that matter are cost per lead, lead volume, and click-through rate, and each is best judged in context. There is no fixed cost per lead or CTR that is right for every account, because results swing with auction demand, audience, objective, season, and creative. What follows is how to read each metric, the real formulas behind them, and how to benchmark your performance against the only baseline that is always relevant: yourself.
Why one universal benchmark does not work for lead gen
A published industry average can feel reassuring, but it rarely matches your situation. Lead gen Facebook Ads benchmarks vary widely depending on what you sell, who you target, and when you run. A local service business bidding against a few competitors in one metro faces a different auction than a national B2B brand targeting a narrow job title.
Several factors move the numbers, and none of them are universal:
- Auction demand. More advertisers competing for the same audience raises costs.
- Audience size and intent. Narrow, high-intent audiences usually cost more per click but can convert better.
- Objective. A lead form objective behaves differently from a traffic or awareness objective.
- Season. Demand and competition shift through the year, which moves cost per lead and CPM.
- Creative. Fresh, relevant creative lifts CTR and lowers cost. Tired creative does the opposite.
Because all five move independently, a number that is excellent for one account can be poor for another. The honest benchmark is your own history.
Cost per lead: the formula and how to judge it
Cost per lead is the headline efficiency metric for most lead gen accounts. The formula is simple:
- Cost per lead = spend / leads
The number on its own tells you very little. To judge whether your cost per lead is healthy, connect it to what a lead is worth to you:
- Close rate. If you close one in ten leads, ten leads buys one customer. Multiply your cost per lead by the leads needed per sale to find your real cost per acquisition.
- Customer value. A higher cost per lead is acceptable when each closed customer is worth more. A law firm or solar installer can absorb a cost per lead that would sink a low-ticket service.
- Prior periods. The most useful comparison is last period. If cost per lead rose while close rate and lead quality held steady, that is worth investigating.
This is why cost per lead and lead quality should be read together. A cheap lead that never closes is more expensive than a costly lead that does. For the full distinction between metrics, see ROAS vs CPL vs CPA explained.
Lead volume: watch the trend, not just the count
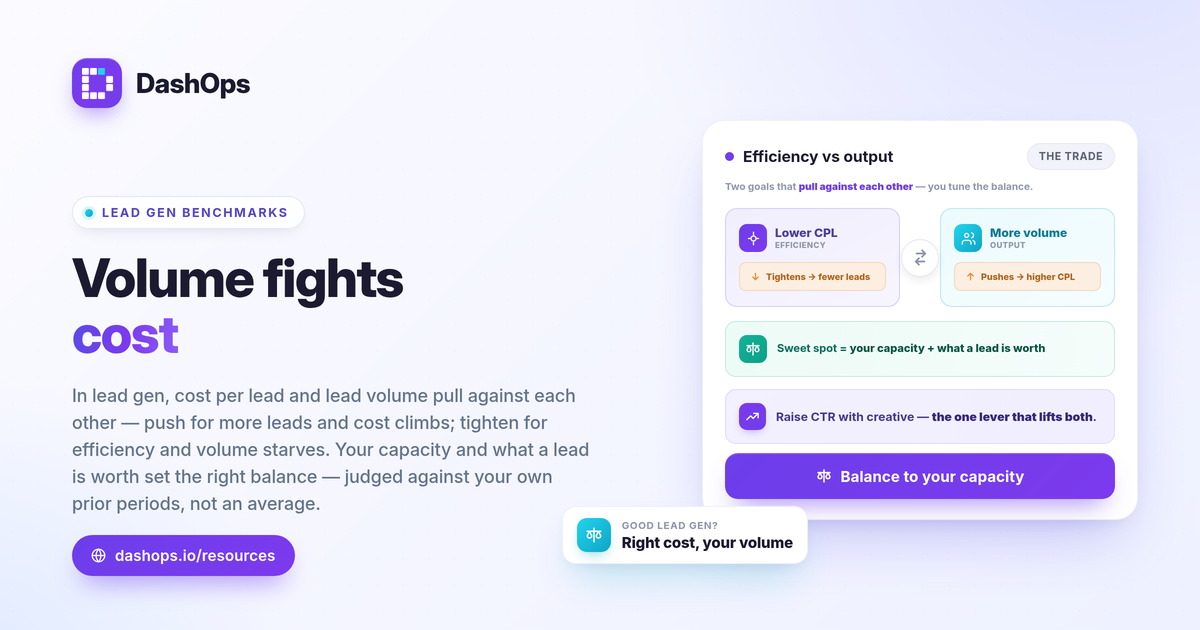
Cost per lead tells you efficiency, lead volume tells you whether the account is producing enough to hit your goals. The two move against each other often: pushing for more volume can raise cost per lead as you reach further into the audience, while tightening for efficiency can starve volume.
Track lead volume as a trend rather than a single total:
- Compare period over period. Did this month produce more or fewer leads than last, and at what cost?
- Watch for pacing problems. A sudden drop mid-period can signal budget exhaustion, audience fatigue, or a form issue.
- Tie volume to capacity. More leads only help if your team can follow up. Volume beyond what you can work is wasted spend.
For B2B Meta Ads benchmarks specifically, lead volume is usually lower and more expensive because audiences are smaller and more targeted. That is expected, not a failure, which is exactly why your own trend beats a borrowed average.
CTR: a leading indicator of relevance
Click-through rate is the earliest signal that your creative and audience are matched. The formula:
- CTR = clicks / impressions
A lead generation CTR benchmark is best read as a direction rather than a fixed target. A rising CTR usually means your creative and offer resonate with the audience you are reaching. A falling CTR, especially alongside rising frequency, often points to fatigue: the same people are seeing the ad too many times and have stopped responding.
To use CTR well:
- Pair it with frequency. If frequency climbs while CTR drops, refresh creative or widen the audience.
- Compare CTR by placement and audience. A demographic or placement breakdown shows where attention is strong and where it is leaking.
- Read it period over period. A CTR that is steady or rising across periods is a healthy sign, regardless of any external average.
Benchmark against yourself with period-over-period comparison
The most reliable way to know if your Meta Ads benchmarks for lead generation are good is to compare the current period to your own past. Period-over-period comparison removes the guesswork that comes from borrowed industry numbers and answers the question you actually have: is this period better or worse than the last, and why.
Set up a consistent read each period:
- Cost per lead this period vs last. Efficiency direction.
- Lead volume this period vs last. Output direction.
- CTR and frequency this period vs last. Relevance and fatigue direction.
When all three sit side by side with their prior values, you can see whether a change to creative, audience, or budget actually moved the result. For the wider metric set worth tracking, see Meta Ads KPIs to track.
DashOps is built around this kind of honest, self-referential benchmarking. It reads your Meta KPIs into one dashboard with period-over-period comparison built in, surfaces lead-gen adaptive KPIs like cost per lead, and includes demographic and placement breakdowns plus frequency so you can spot fatigue early. Instant Forms leads can be exported to CSV or Excel, which matters because Meta only lets you download leads directly from the Page for a limited window of about 90 days. See what each plan includes on the pricing page, and the help center covers connecting an ad account. If you want to understand why dashboard numbers and Ads Manager sometimes diverge, Facebook Ads Manager vs a reporting dashboard explains the difference.
The practical takeaway: pick your own prior period as the benchmark, line up cost per lead, lead volume, and CTR against it each cycle, and judge good or bad by whether the trend moves toward your goals.
Frequently asked questions
What is a good cost per lead on Meta Ads?
Why is my Meta Ads CTR low for lead generation?
How do I benchmark B2B Meta Ads against my own results?
See it in your own dashboard
DashOps brings Meta Ads reporting, campaign management, and white-label client portals into one place. Pick the plan that fits how you run ads.