Meta Ads Benchmarks by Objective: How Awareness, Traffic, Leads and Sales Campaigns Compare
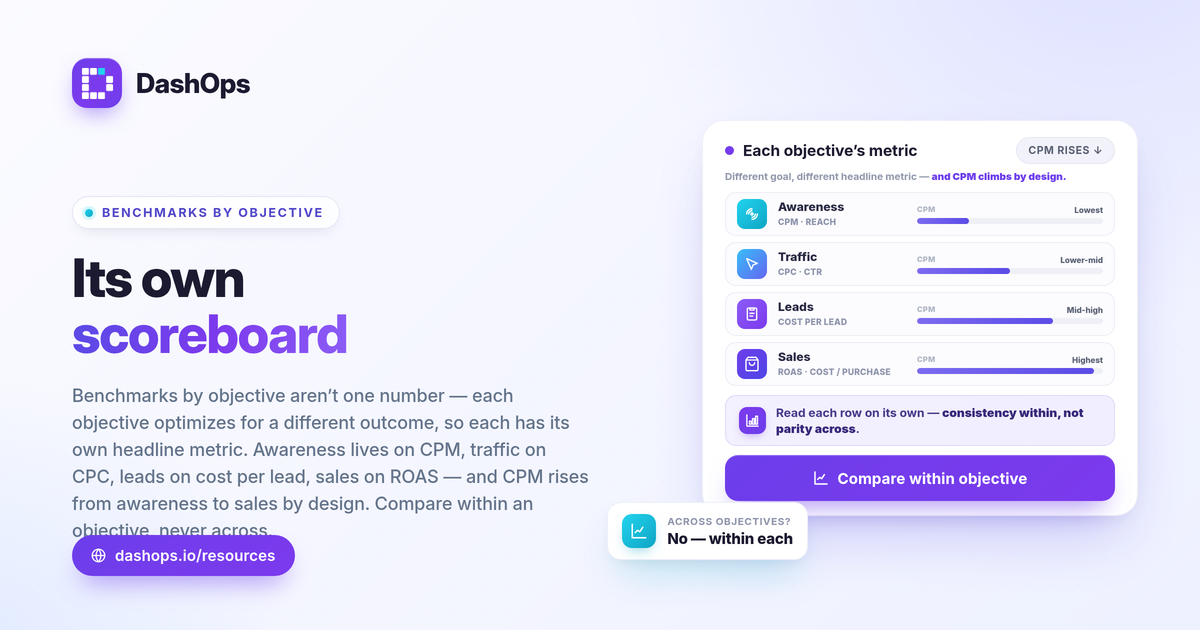
Meta Ads benchmarks by objective are not one number you can look up, because each campaign objective optimizes for a different outcome and therefore produces different costs. An awareness campaign buying cheap impressions will always show a lower CPM than a sales campaign chasing purchasers, and that gap is by design, not a problem. The useful comparison is within an objective, judged against your own prior period and your margin. This guide breaks down how awareness, traffic, leads and sales objectives differ on CPM, CTR, CPC and conversion cost, and gives you the formulas to benchmark each one against yourself rather than against a borrowed industry figure.
Why objective decides which numbers matter
When you pick a campaign objective, you tell Meta what to optimize for. That single choice changes which auction you compete in, which audience the system targets, and which metric you should treat as the headline.
- Awareness and reach optimize for the cheapest qualified impressions. The metric that matters is CPM and reach, not clicks or purchases.
- Traffic optimizes for link clicks or landing page views. CPC and CTR become the headline; downstream conversions are secondary because the system is not optimizing for them.
- Leads optimizes for form completions, often through Meta Instant Forms. Cost per lead is the number to watch, with CTR and CPC as supporting signals.
- Sales optimizes for purchases. Cost per purchase and ROAS are the headline, and CPM tends to be the highest because the audience pool is the most competitive.
Reading a sales campaign as if it were a traffic campaign, or holding awareness to a sales-level cost per result, is the most common reporting mistake. Each objective has its own scoreboard.
How awareness vs conversion benchmarks differ
The awareness vs conversion benchmarks comparison usually surprises people because the direction is consistent: as the objective moves from awareness toward sales, CPM rises and the cost per result rises with it.
- Awareness competes for attention at scale, so CPM is typically lowest. CTR can look modest because the audience is broad and not in a buying mindset.
- Traffic sits in the middle. CPC and CTR improve relative to awareness because the system selects clickers, but those clicks are not pre-qualified to convert.
- Leads and sales compete for the narrowest, most valuable audiences. CPM is highest, and the cost per conversion reflects how hard Meta has to work to find someone who acts.
None of these are universal numbers. CPM, CTR and CPC move with auction demand, your audience size, your creative, the season, and your objective. That is exactly why a single published figure cannot tell you whether your account is healthy. Your own trend can.
The formulas behind every objective benchmark
You do not need an external dataset to benchmark. You need the formula and your own prior period. These are the calculations that sit under every objective:
- CTR = clicks / impressions. Higher CTR means your creative and audience match. Compare it within an objective.
- CPC = spend / clicks. Lower is better, but only meaningful next to CTR and the quality of the click.
- CPM = spend / impressions times 1000. The price of attention. Awareness should run lower; sales runs higher.
- Cost per lead = spend / leads. The headline for lead-gen objectives.
- Cost per purchase = spend / purchases, and ROAS = conversion value / spend. The headline for sales.
- Break-even ROAS = 1 / profit margin. This tells you the ROAS your sales campaigns must clear to be profitable, which is a far more honest target than any industry average.
If you want a deeper walk through each metric, the KPIs worth tracking covers what to read and what to ignore, and ROAS vs CPL vs CPA explained sorts out which conversion cost belongs to which objective.
Benchmark against yourself, not a borrowed number
Real benchmarks vary widely by industry, objective, audience and season. A cost per lead that is excellent for a high-ticket service would be alarming for an impulse e-commerce purchase, and a CPM that is normal in a low-competition niche would be punishing in a crowded one. Chasing one universal figure leads you to optimize toward someone else’s economics.
The reliable method is period-over-period comparison within each objective:
- Segment by objective first. Group awareness, traffic, leads and sales campaigns separately so you never compare across scoreboards.
- Compare each group to its own prior period. Did this month’s leads campaigns lower cost per lead at similar spend? That is a real benchmark.
- Anchor sales to break-even ROAS. Your margin sets the target, not a published average.
- Watch frequency and trend together. Rising frequency with a climbing CPM and softening CTR within one objective is an early fatigue signal you would miss by staring at a single static benchmark.
This is also why Ads Manager alone can mislead: it shows the current window without the side-by-side history. The difference between the two views is covered in Ads Manager vs a reporting dashboard.
A simple objective comparison cheat sheet
This Meta Ads objective comparison summarizes which metric to lead with and what direction to expect as the objective shifts. The arrows describe relative tendencies, not fixed numbers.
| Objective | Headline metric | CPM tendency | What “good” means |
|---|---|---|---|
| Awareness / Reach | CPM, reach | Lowest | Beats your prior period at equal or wider reach |
| Traffic | CPC, CTR | Lower-mid | CTR up and CPC down versus last comparable period |
| Leads | Cost per lead | Mid-high | Cost per lead your margin supports, trending down |
| Sales | Cost per purchase, ROAS | Highest | ROAS clears your break-even ROAS, improving over time |
Read each row on its own line. The lead-gen vs sales objective metrics gap, where leads often look cheaper per action than purchases, is normal because a form fill is a lower-commitment event than a sale. The point is consistency within the objective, not parity across them.
Bringing it together in your reporting
Once campaigns are grouped by objective, the work is mostly a reporting habit: read the right headline metric for each group and compare it to the same group last period. DashOps shows CPM, CTR, CPC, cost per lead, cost per purchase and ROAS across your Meta ad accounts in one dashboard, with period-over-period comparison and demographic and placement breakdowns so you can see where a number moved. Its lead-gen versus e-commerce adaptive KPIs surface the right conversion cost automatically depending on the objective. See what each plan includes on the pricing page, and the help center walks through connecting an account and segmenting your view.
The practical takeaway: stop hunting for a universal Meta Ads benchmark by objective and start comparing each objective to its own last period, with your profit margin setting the bar for sales.
Frequently asked questions
Why are my awareness campaigns cheaper per result than my sales campaigns?
What is a good CTR or CPC for a leads campaign on Meta?
Can I compare benchmarks across awareness, traffic, leads and sales in one place?
See it in your own dashboard
DashOps brings Meta Ads reporting, campaign management, and white-label client portals into one place. Pick the plan that fits how you run ads.