Meta Ads Benchmarks by Industry 2026: Median ROAS, CTR, CPM, CPC and CPL
If you are searching for Meta Ads benchmarks by industry, the honest answer is that no single median ROAS, CTR, CPM, CPC or CPL fits every account, and chasing a universal number usually leads you astray. Real Facebook Ads benchmarks vary widely by industry, objective, audience, season and creative, which is exactly why your own history is the most reliable yardstick. This report explains why Meta Ads average metrics move the way they do, gives you the real formula for each one, and shows how to judge “good” against your goals, your margin and your prior period instead of a borrowed figure.
Why one industry benchmark number rarely fits your account
Meta delivers ads through an auction. The price you pay and the response you get reflect live competition for the audience you target, the objective you chose, and the moment you are buying in. Two businesses in the same category can post very different numbers because their margins, offers, creative and audiences differ.
That is the core problem with industry advertising benchmarks presented as a single figure. A median is built from a huge spread of accounts, and your account sits somewhere on that spread for reasons a median cannot see. Treating someone else’s median CPL as a target can push you to cut spend on a campaign that is actually profitable for your margin, or to keep one that is not.
The factors that move every Meta and Instagram Ads metric are consistent:
- Auction demand. More advertisers competing for the same audience raises CPM and CPC.
- Audience. Narrow, high-intent or expensive-to-reach audiences cost more than broad ones.
- Objective. A campaign optimized for purchases behaves differently from one optimized for reach or leads.
- Season. Demand and competition shift through the year, which moves costs up and down.
- Creative. Fresh, relevant creative tends to earn more efficient delivery than fatigued creative.
The metrics, and the formula behind each one
You do not need a benchmark table to read your performance. You need the formula and a clear idea of what each number is telling you. These are the Meta-native calculations DashOps reports directly.
- CTR (click-through rate) = clicks / impressions. How often people who saw the ad clicked. A signal of creative and audience relevance.
- CPC (cost per click) = spend / clicks. What each click costs. Driven by CTR and auction competition.
- CPM (cost per 1,000 impressions) = spend / impressions times 1,000. The cost to reach people. Mostly set by auction demand and audience.
- ROAS (return on ad spend) = conversion value / spend. Revenue earned per unit of spend, the core e-commerce efficiency number.
- CPL (cost per lead) = spend / leads. What each lead costs, the core lead-gen efficiency number.
- Break-even ROAS = 1 / profit margin. The ROAS at which an e-commerce campaign neither makes nor loses money.
For deeper definitions of each KPI and how they connect, see Meta Ads KPIs to track. For the difference between efficiency metrics, ROAS vs CPL vs CPA explained is a useful companion.
How to decide what “good” means for you
“Good” is not a number you read off a chart. It is a number that clears your own threshold. Here is how to set that threshold for each metric.
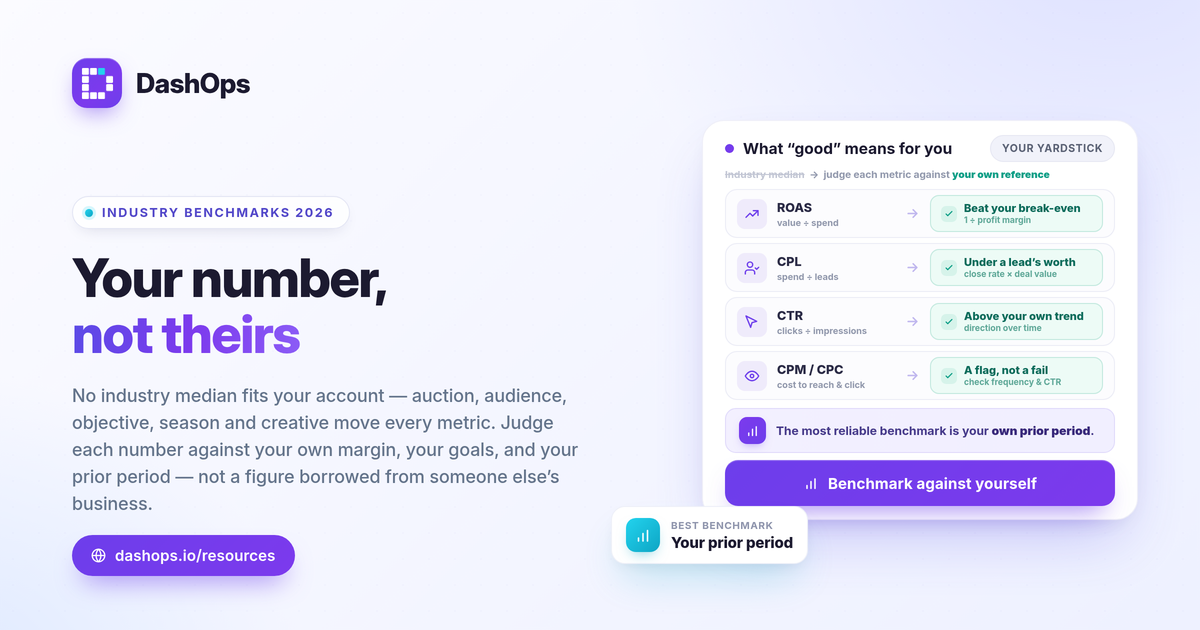
- ROAS. Compare it to your break-even ROAS first. Plug your own margin into the formula: if a business runs at a profit margin of one half, break-even ROAS is 2, so a ROAS above 2 makes money and below it loses money, no matter what an industry average says. A high-margin business can be happy at a ROAS a low-margin business cannot survive, which is why you use your own margin rather than a borrowed figure.
- CPL. Compare it to what a lead is worth to you. Cost per lead only means something next to your close rate and average deal value. A higher CPL can still be excellent if those leads convert and the deal is large.
- CTR. Read it as a relevance signal for your creative and audience, then watch its direction over time rather than against an outside figure.
- CPM and CPC. Treat rising costs as a prompt to investigate, not an automatic failure. A higher CPM with steady or rising ROAS is often fine.
This is also why the same metric is judged differently depending on what you sell. Lead-gen and e-commerce care about different headline numbers, which is covered in lead-gen vs e-commerce Meta KPIs.
Benchmark against yourself with period-over-period comparison
The most honest benchmark you have is your own account under similar conditions. Comparing this period to your prior period removes the industry, audience, objective and seasonal differences that make external Facebook Ads benchmarks 2026 so unreliable, because you are holding most of those variables constant.
A period-over-period view answers the question that actually matters: is this campaign type doing better or worse than last time, and what changed. To make that comparison fair:
- Match the objective. Compare a purchase campaign to a purchase campaign, not to a reach campaign.
- Match the window. Compare like for like, for example this month to last month or this quarter to the same quarter prior, so seasonality is accounted for.
- Watch frequency alongside CPM. Rising frequency with a climbing CPM and a falling CTR is a classic fatigue pattern that no external benchmark would reveal. Demographic and placement breakdowns help you see where that is happening.
Read costs in context, not in isolation
A jumping CPM or CPC is not proof that something is broken. It is a flag to look closer. Often the cause is seasonal auction pressure, a new competitor, or a narrowed audience. Sometimes it is creative fatigue, which you can confirm by checking frequency and CTR trend together rather than reacting to the cost number alone.
Keep in mind that reported conversions can undercount the truth. The iOS App Tracking Transparency changes mean some conversions are not attributed, so Meta-reported ROAS can look lower than your real return. This is a reason to reconcile against your own sales records and, again, to trust your own trend over a borrowed median.
DashOps reads 17+ Meta KPIs across all your ad accounts in one dashboard with period-over-period comparison built in, plus demographic and placement breakdowns and frequency as a KPI, so you can benchmark your own performance honestly instead of chasing a universal number. See what each plan includes on the pricing page, and the help center covers connecting your accounts and setting comparison periods.
The most useful benchmark for any Meta Ads account is its own prior period, judged against your goals and margin, not a median pulled from someone else’s business.
Frequently asked questions
What is a good ROAS or CPL on Meta Ads?
Why do Meta Ads benchmarks vary so much by industry?
How should I benchmark my own Facebook Ads performance?
See it in your own dashboard
DashOps brings Meta Ads reporting, campaign management, and white-label client portals into one place. Pick the plan that fits how you run ads.