How to Measure Facebook Lead Quality and Report on Qualified Leads, Not Just Volume
Facebook lead quality reporting means layering a qualification signal onto the lead volume and cost numbers Meta already returns, so your report answers the real question: which campaigns deliver leads that convert, not just leads that arrive. Meta can tell you how many people submitted a form and what each one cost. It cannot tell you whether those people were real prospects. To measure lead quality in Meta ads, you connect raw volume to what happens after the form: contact rate, qualification, and eventually closed business. This guide walks through a practical method for qualified lead tracking that turns a volume report into a quality report.
Why volume alone hides the truth
A campaign that produces many cheap leads looks like a winner in Meta Ads Manager. But cost per lead only measures the price of a form submission, not the value of it. Two campaigns can show the same cost per lead while one fills your pipeline and the other fills it with wrong numbers, tire-kickers, and people who never wanted what you sell.
The gap exists because Meta sees the form submit and stops there. Qualification happens later, in a phone call, an email reply, or a CRM stage change. If your reporting stops where Meta stops, you optimize toward whatever is cheapest to submit a form, which is rarely whatever is most likely to buy. The fix is to carry a quality signal back to the campaign that produced it.
Define what a qualified lead actually means
Before you can report on quality, you need a written definition. Without one, qualified becomes a feeling rather than a metric. Keep it specific to your business:
- Contactability. Valid phone number or email, and the lead answers or replies.
- Fit. The lead matches who you actually serve: right location, right service, right size.
- Intent. The lead wants what you offer now or soon, not someday.
- Budget or eligibility. For higher-ticket offers, the lead can afford or qualify for the thing.
Write the definition down and apply it the same way every time. The point is consistency: a lead-quality metric is only useful if qualified means the same thing in March as it did in January.
Layer quality signals onto the report
Once you have a definition, add a small set of lead quality metrics on top of the volume metrics. You do not need many. A useful layered view tracks:
- Lead volume. Total Instant Form submissions, straight from Meta.
- Cost per lead. Spend / leads, the Meta-native efficiency number.
- Qualified leads. The count that met your definition, sourced from your CRM or sales notes.
- Qualification rate. Qualified leads / total leads, the share that were real.
- Cost per qualified lead. Spend / qualified leads, the number that actually matters.
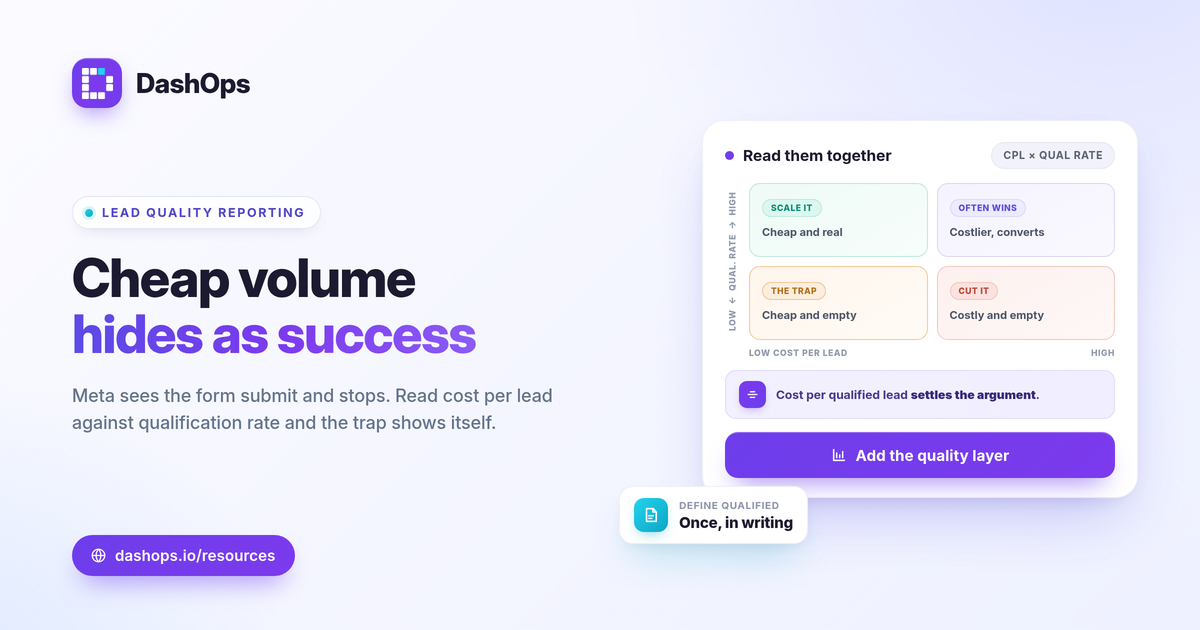
Cost per qualified lead is the metric most lead-gen reports are missing. A campaign with a low cost per lead but a poor qualification rate ends up with a high cost per qualified lead, and that comparison is what exposes cheap-but-empty volume. For a deeper look at how these efficiency metrics relate, see roas vs cpl vs cpa explained.
Where each number comes from
The volume side and the quality side live in different systems, and that is the whole challenge. Knowing the source of each number keeps the method honest.
| Metric | Source |
|---|---|
| Spend, lead volume, cost per lead | Meta ads reporting |
| Qualified status, qualification rate | Your CRM or sales process |
| Cost per qualified lead | Calculated by joining the two |
The join happens on the campaign. Export your leads with their campaign attribution, tag each one as qualified or not in your own system, then bring the qualified count back against the spend Meta reports for that same campaign and period. One reliable way to start that export is covered in export meta instant form leads csv.
Keep the export window in mind
There is a hard platform constraint worth planning around. Meta only lets you download Instant Form leads directly from the Page for a limited window, about 90 days, after which the leads must be retrieved through the API or a connected tool. If your sales cycle is long, or you only review quality monthly, leads can age out of the direct download before you have tagged them. Pull leads on a regular cadence so nothing falls off the back of that window, and your quality reporting stays complete rather than full of gaps you cannot fill later.
Read the numbers together, not in isolation
The value of this method is in the comparison. Looking at any single metric on its own returns you to the volume trap. Instead, read them as a set across campaigns:
- Low cost per lead, high qualification rate. The campaign you want more of.
- Low cost per lead, low qualification rate. Cheap volume that wastes sales time. The classic trap.
- Higher cost per lead, high qualification rate. Often the real winner once you look at cost per qualified lead.
Then add the time dimension. A period-over-period comparison tells you whether qualification rate is holding or slipping. A rising cost per qualified lead while spend stays flat is an early warning that a campaign is decaying in quality even if volume looks fine, which is the kind of signal a volume-only report never surfaces.
A note on attribution and undercounting
When you reconcile Meta-reported leads with what your CRM shows, expect some mismatch, and do not panic over it. Privacy changes on iOS and the broader shift toward limited tracking cause Meta to undercount and attribute conversions imperfectly, so the numbers rarely line up to the decimal. The method still works because you are comparing campaigns against each other using a consistent definition, not chasing a perfect tie-out. Hold your qualification standard steady and the relative ranking of campaigns stays trustworthy even when the absolute totals drift.
Bringing it into your reporting workflow
DashOps reports Meta-native lead metrics, including lead volume, cost per lead, and period-over-period trends, alongside Meta Instant Forms lead capture with CSV and Excel export, so the volume half of this method sits in one dashboard across every ad account you run. Qualification status lives in your CRM, and the workflow is to export leads from DashOps, tag them in your own system, and read cost per qualified lead back against the spend DashOps already tracks per campaign. You can see what each plan includes on the pricing page, and the help center covers lead export and report setup. For the broader metric foundation, meta ads kpis to track is a useful companion.
The practical takeaway: write down what qualified means, carry that label back to the campaign that produced the lead, and report cost per qualified lead next to cost per lead so cheap volume can never hide as success.
Frequently asked questions
What is the difference between a lead and a qualified lead in Meta ads reporting?
How do I calculate cost per qualified lead?
Can DashOps tell me if a lead is qualified?
See it in your own dashboard
DashOps brings Meta Ads reporting, campaign management, and white-label client portals into one place. Pick the plan that fits how you run ads.