How to Build a Lead-Gen Facebook Ads Report That Tracks Cost Per Lead
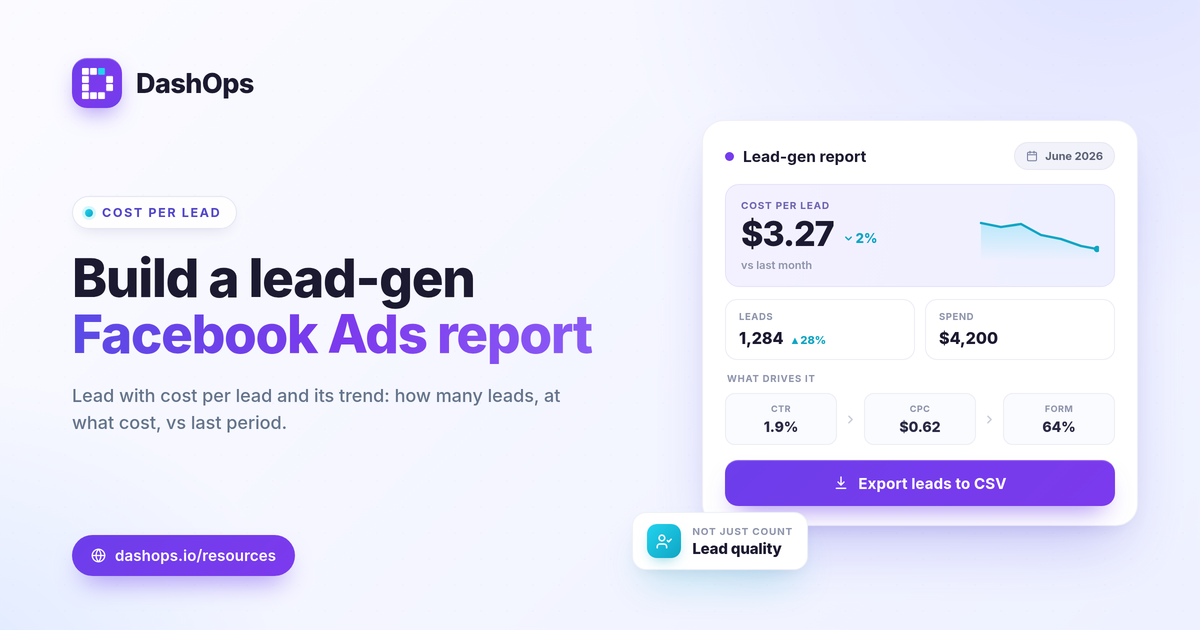
A lead-gen Facebook Ads report has one job: show whether your spend is producing leads at a cost you can afford, and whether that cost is moving in the right direction. Unlike an e-commerce report built around ROAS and purchases, a lead generation ad report centers on leads, cost per lead, and the quality of what comes through your Meta Instant Forms. Build it so the reader can answer three things at a glance: how many leads, at what cost each, and whether that beat the last period. Everything below is supporting detail. Here is how to structure a lead-gen Facebook Ads report that holds up.
Start with leads and cost per lead
Open with the two numbers tied to the goal, not every metric Meta returns. For lead gen, that pairing is volume and efficiency.
- Leads and spend. How many leads you captured and what you spent to get them, side by side.
- Cost per lead. The headline efficiency metric. Cost per lead = spend / leads. This is the number a stakeholder remembers.
- Lead trend. Whether cost per lead is rising or falling versus the prior period, which matters more than the raw figure.
DashOps adapts its KPIs to the account: when an account is running lead campaigns, the dashboard surfaces leads and cost per lead as primary tiles instead of forcing e-commerce metrics like ROAS into the spotlight. That keeps the cost per lead report focused on what a lead-gen advertiser actually optimizes.
Decide what counts as a lead
Before the numbers mean anything, define the unit. Meta can report leads from Instant Forms, from website conversion events, or from messaging objectives, and they are not the same thing.
- Instant Form leads are captured natively inside Facebook or Instagram. The user never leaves the platform, so reporting tends to be complete and fast.
- Website leads depend on the Meta pixel and the Conversions API firing correctly. Since iOS and App Tracking Transparency, browser-based conversions can be undercounted, so a website lead count may sit lower than reality.
State which definition your report uses in a single line near the top. A reader comparing two months needs to know the leads being counted are the same kind in both periods. For more on choosing your core metrics, see the Meta Ads KPIs worth tracking.
Build the cost per lead report from the funnel down
Cost per lead is an outcome, not a lever. To explain why it moved, walk the funnel that produces it and show the metric at each step.
- CTR = clicks / impressions. A falling click-through rate usually points to creative fatigue or a worn-out audience.
- CPC = spend / clicks. Rising cost per click pushes cost per lead up even when your form converts the same.
- Form completion. The share of people who opened the form and submitted it. A weak form, too many fields, or a vague offer shows up here.
When cost per lead climbs, one of these three is almost always the cause. Reporting them together turns a number into a diagnosis, which is the difference between a report that informs and one that just records.
Include Meta Instant Forms reporting and lead detail
A lead generation ad report should connect the dashboard numbers to the actual leads. Meta Instant Forms reporting is more useful when the reader can see the records behind the count, not just a total.
- Lead volume by campaign and form. Which campaign and which form produced the leads, so you can shift budget toward what works.
- The lead records themselves. Names, contact details, and any custom question answers captured by the form.
- Export for follow-up. A Facebook leads report is only half the value if sales cannot reach the people in it. Getting the leads into a CRM or a spreadsheet quickly is the other half.
There is a practical deadline here worth building your process around. Meta only lets you download Instant Form leads directly from the Page for a limited window, about 90 days, after which they must be retrieved through the API or a connected tool. A reporting workflow that pulls leads continuously means you are never racing that clock. DashOps captures Meta Instant Forms leads and lets you export them to CSV or Excel, so the records stay available past the Page download window.
Judge cost per lead against your own targets
There is no universal good cost per lead, and any report that implies one is misleading. A solar installer and a local gym have completely different economics, so the only honest benchmark is your own.
- Your prior period. The clearest signal. A period-over-period comparison shows whether this month beat last month at the same job.
- Your lead value. Work backward from what a closed lead is worth and what share of leads convert. That tells you the cost per lead you can sustain.
- Lead quality, not just count. A cheaper cost per lead that produces leads sales cannot close is not a win. Track where the cheap leads actually convert, since the dashboard shows volume but your CRM shows quality.
Framing the number against goals and trend, rather than a made-up average, is what keeps a lead-gen Facebook Ads report honest and useful.
Add breakdowns to find where leads come from
Once the headline is set, breakdowns explain it. Two are especially useful for lead gen.
- Demographics. Age and gender breakdowns show which segments produce leads efficiently, which can reshape targeting.
- Placement. Whether leads come more cheaply from Feed, Stories, Reels, or another placement guides where the budget should sit.
An Ads Manager export gives you these too, but a dashboard keeps them in one consistent view across periods. For the distinction between the two tools, see Ads Manager versus a reporting dashboard.
Make it repeatable and shareable
A report you rebuild by hand every month tends to drift in format and slip in timing. Lock the structure once, then keep it consistent so each period is comparable to the last.
DashOps reads every lead-gen KPI across your Meta ad accounts in one dashboard with period-over-period comparison built in, surfaces cost per lead as a primary metric, captures Instant Forms leads with CSV and Excel export, and can send the result as a scheduled PDF or a white-label client report. See what each plan includes on the pricing page, and the help center covers connecting an account and setting up exports. If your reports go to clients, white-label client reporting covers presenting them cleanly.
The strongest lead-gen report makes cost per lead and its trend the first thing anyone sees, then gives them the funnel and the lead records to understand it.
Frequently asked questions
What is the most important metric in a lead-gen Facebook Ads report?
How do I report on Meta Instant Forms leads?
Why does my Facebook leads report count differ from my CRM?
See it in your own dashboard
DashOps brings Meta Ads reporting, campaign management, and white-label client portals into one place. Pick the plan that fits how you run ads.