Facebook Ads Report Example: Free Sample PDF
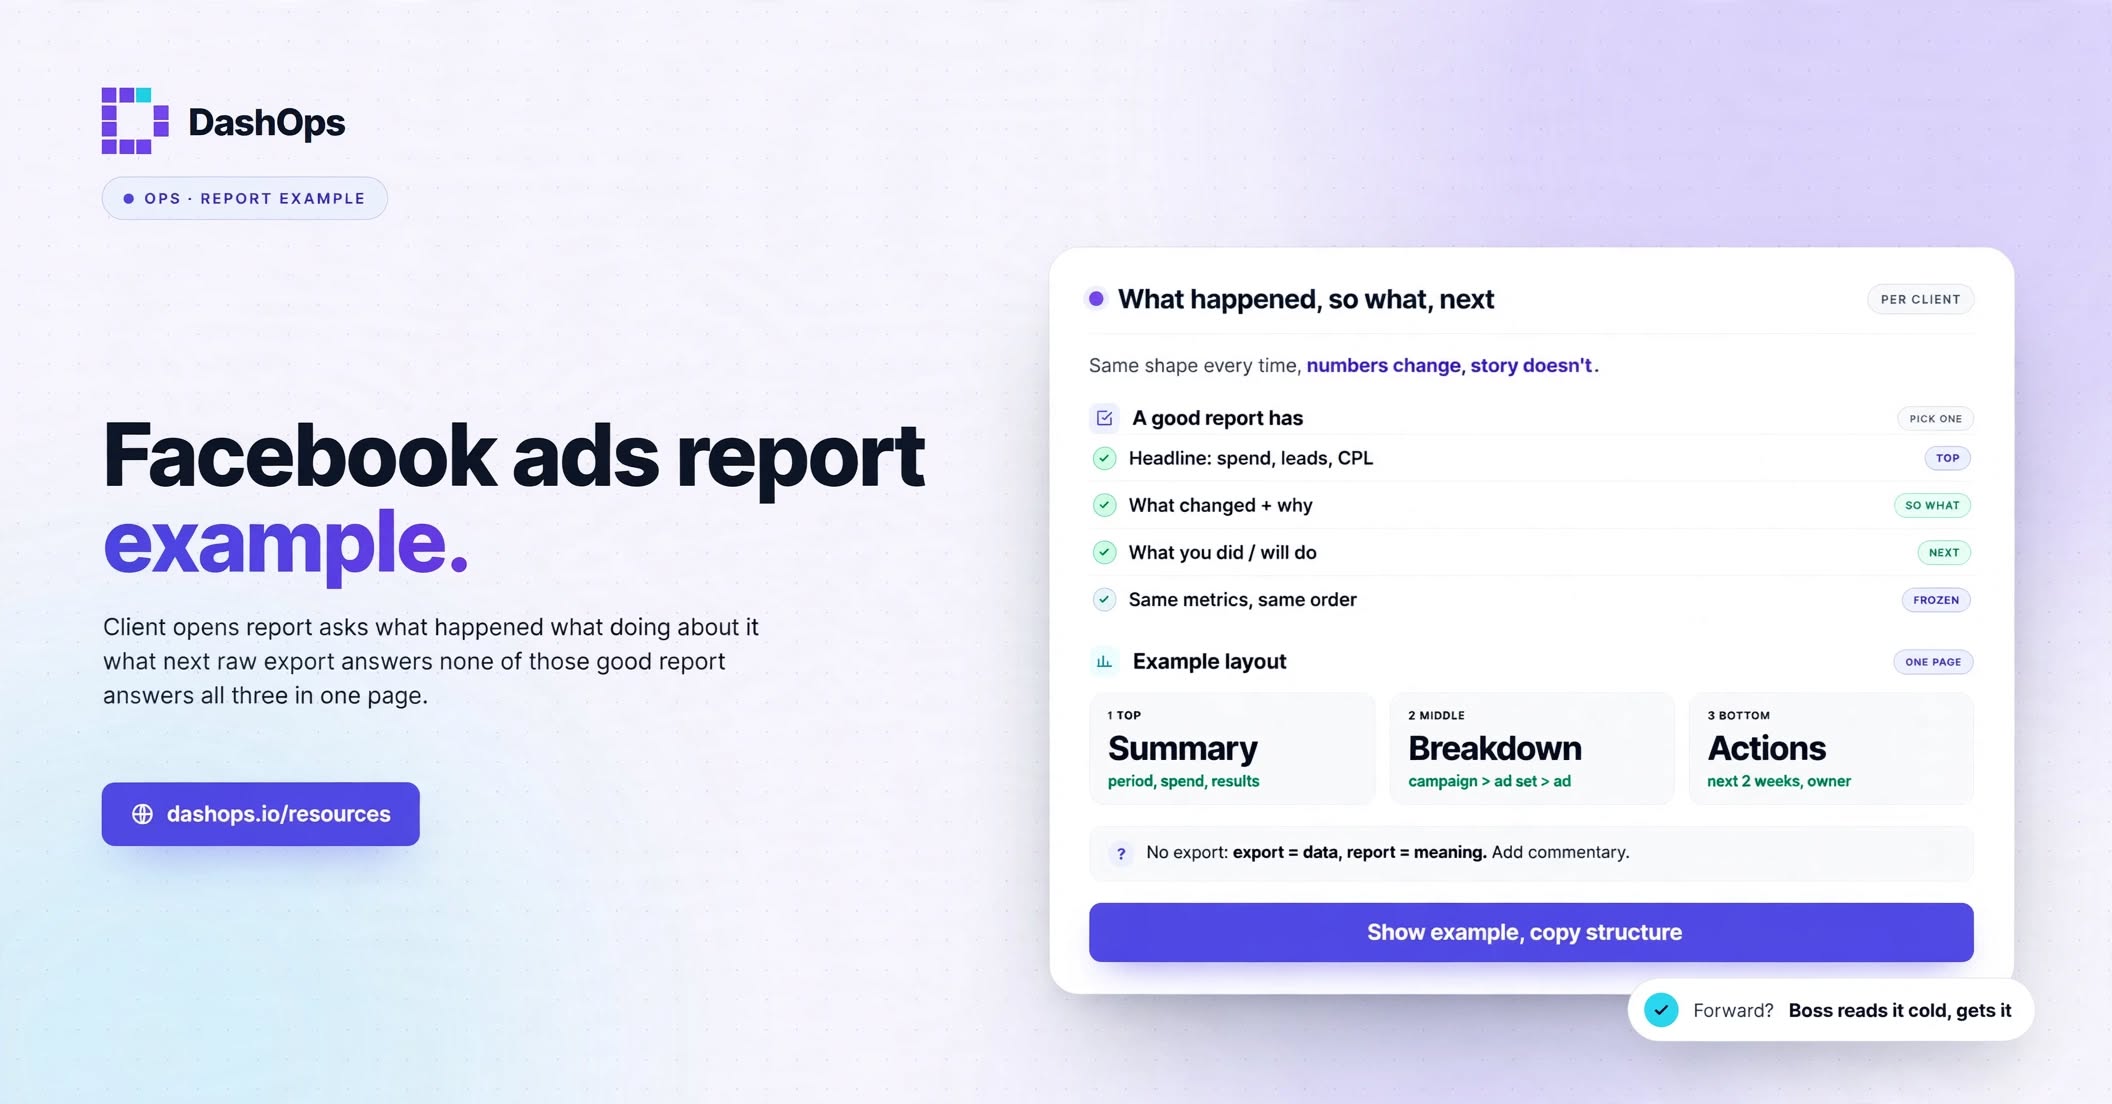
Here is a finished Facebook Ads report you can open right now: the sample report as a PDF, eight pages, no form and no signup, with every number made up for two fictional companies. The sample shows a layout and is not a DashOps export. When you want your own version, the blank Excel file has the same sections and fills from an Ads Manager export you paste in.
The PDF holds two complete reports, because a business that wants leads and a shop that wants sales need different numbers at the top.
| Pages | Fictional company | Ad account | Main result |
|---|---|---|---|
| 1 to 4 | Contoso Studios, a design studio that sells workshops | act_DEMO_001 | Website leads |
| 5 to 8 | Acme Apparel, an online clothing shop | act_DEMO_002 | Purchases |
Both cover October 2026 against September 2026, and every page carries a Demo data label. None of the figures is a benchmark, so copy the structure and ignore the numbers.
Page by page: the lead report
Page 1 gives the answer in words, then the key numbers. The report opens with four plain sentences before any table. For example, the first one reads “Spend was 4,364.51 USD in October, up 14.3% from September.” A client who reads nothing else still knows what happened. Below that sits a grid of eleven numbers, each with its change from September. For a business that wants leads, read these four first:
| Number | October, demo | Change from September, in percent |
|---|---|---|
| Spend | 4364.51 | +14.3 |
| Link clicks | 6608 | +14.1 |
| Website leads | 243 | +13.6 |
| Cost per website lead | 11.31 | -1.3 |
Read together, they say spend and leads rose at about the same pace, so each lead cost about the same. One small note under the grid is worth copying into your own report: “Reach is not added up. One person can appear in two rows, so adding rows counts them twice.”
Page 2 shows the trend and keeps results apart. Two charts show spend per day and website leads per day, so a reader can see when something changed. Under them is a table of results by type:
| Result type | Results | Spend of those campaigns | Cost per result |
|---|---|---|---|
| Website leads | 243 | 2747.47 | 11.31 |
| Link clicks | 2273 | 970.26 | 0.43 |
| Landing page views | 912 | 646.78 | 0.71 |
The account ran campaigns with three different goals, so there are three lines and no grand total. Adding 243 leads to 2,273 clicks gives a number that means nothing.
Page 3 lists campaigns, then placements. The campaign table runs highest spend first, with Spend, Impressions, Link clicks, CTR, CPC, CPM, Result type, Results and Cost per result. Its Total row leaves Results empty for the reason above. The placement table has six rows, such as “Facebook: Feed” and “Instagram: Instagram Reels”, with website leads and cost per lead for each.
One sum on this page is easy to get wrong in your own report. Cost per lead counts only the spend of the lead campaigns: 2,747.47 / 243 = 11.31. Dividing all spend by leads gives 4,364.51 / 243 = 17.96, which charges the traffic campaigns to leads and makes every lead look dearer than it was.
Page 4 ends with what happens next. Four numbered steps, each naming something to do. The first reads: “Try moving some budget from Demo Workshop Leads to Demo Newsletter Leads, and check the cost per lead after two weeks.” Another says to check that the lead numbers match the sign-up list, because a report is only useful if the numbers in it agree with the client’s own records.
What changes in the shop report
Pages 5 to 8 keep the same order and change which numbers lead. Spend, Purchases, Purchase value, ROAS, Average order value and Cost per purchase come first. The campaign table swaps to the numbers a shop decides on:
| Campaign, demo | Spend | Purchases | Purchase value | ROAS | Cost per purchase |
|---|---|---|---|---|---|
| Demo Autumn Sale | 3877.71 | 99 | 6146.06 | 1.58 | 39.17 |
| Demo New Arrivals | 2263.83 | 42 | 2330.35 | 1.03 | 53.90 |
| Demo Retargeting Cart | 1293.67 | 69 | 3994.46 | 3.09 | 18.75 |
| Demo Gift Guide | 970.09 | 13 | 622.08 | 0.64 | 74.62 |
| Total | 8405.30 | 223 | 13092.95 | 1.56 | 37.69 |
The Total row’s ROAS comes from the summed parts, 13,092.95 / 8,405.30 = 1.56, and is never an average of the column above it. This table is what the next step on page 8 rests on: “Try moving some budget from Demo Gift Guide to Demo Retargeting Cart, and check ROAS after two weeks.”
Paid ads only, not organic posts
This report covers paid ads only. Organic posts, the ones you publish to a Page or a profile without paying to run them, are not in the sample. The blank Excel file cannot add them either, because it reads an Ads Manager export. If a client wants both, report organic posts separately, from their own source.
Build your own from the blank Excel file
The Excel file opens on a How to use tab. Its Monthly report tab has the same sections as the PDF, plus a What changed box, and its Demo monthly report tab holds the same numbers as pages 1 to 4, so you can check your layout against a finished one. Its campaign table keeps the columns from page 3 whatever you paste, so a shop reads ROAS and purchase value for the whole account under Key numbers, not per campaign. The file does not update by itself: your report is as current as your last paste.
- In Ads Manager, open the ad account and stay on the Campaigns tab. The file reads the Campaign name column from there, and an export from the Ads or Ad sets tab gets an instruction and no numbers.
- Pick whole months, such as last month and the month before. A range like Last 30 days cuts across two months, so neither is complete.
- Open Columns, then Customize columns, and tick Amount spent, Impressions, Reach, Link clicks, Results, Landing page views, Leads, Purchases and Purchases conversion value.
- Open Breakdown, then By time, and choose Day.
- Open Reports, choose Export table data, and pick CSV. Meta’s help page on exporting names the same menu.
- Open the CSV in Excel and copy everything, including the top row.
- Open the workbook. If Excel shows Protected View, click Enable Editing first, or it will not let you paste. On the Paste your export tab, select everything, press Delete, click cell A1 and paste.
- Open the Monthly report tab and read the line under the title. It says what is ready and what is missing.
Menu words in Ads Manager can change, so if one differs, look for the nearest match.
Do not skip step 4. A default export has no days in it: it is one block of dates. The key numbers then fill for that block with no month before to compare, and the charts stay empty. With one row per day, the tab can split the months and draw the charts.
A placement table needs one more choice: also pick Placement in Breakdown, if Ads Manager lets you keep Day at the same time. If it will not, keep Day. The placement table stays empty and the rest fills.
Then do the part no export can do. Company, Summary in words, What changed and Next steps are yellow boxes for you to type in, and page 4 of the PDF shows how specific the steps can be. Reach is yellow too: read it from Ads Manager’s own total for those dates and type it in. An export with no breakdown holds one row per campaign, so it gives you the figure only for a report on one campaign.
Still deciding what to report?
Read what a Meta Ads report should include. For the template in more detail, see the free Facebook Ads report template guide and the guide to building a Meta Ads report template in Excel.
Would you rather not paste exports at all? In DashOps, you can download a PDF report for the dates you choose.
Frequently asked questions
Did the numbers in this sample come from a real ad account?
Can I use the numbers in this example as benchmarks?
Does the example include organic Facebook or Instagram posts?
Can I edit the PDF for my own client?
Why does my Monthly report have numbers but no charts?
See it in your own dashboard
DashOps brings Meta Ads reporting, campaign management, and white-label client portals into one place. Pick the plan that fits how you run ads.