Free Facebook Ads Report Template: Download PDF, Excel and CSV Formats
A Facebook Ads report template saves you from rebuilding the same layout every week and keeps every report answering one question for whoever reads it: did the money work, and what changed. Below you can grab a ready-to-use structure in three formats, PDF for a clean read-only summary, Excel for a filterable workbook, and CSV for raw rows that feed another tool. The rest of this guide walks through every section the template includes and the exact Meta Ads KPIs to put in each one, so you can fill it in confidently whether you run ads for your own business or for clients.
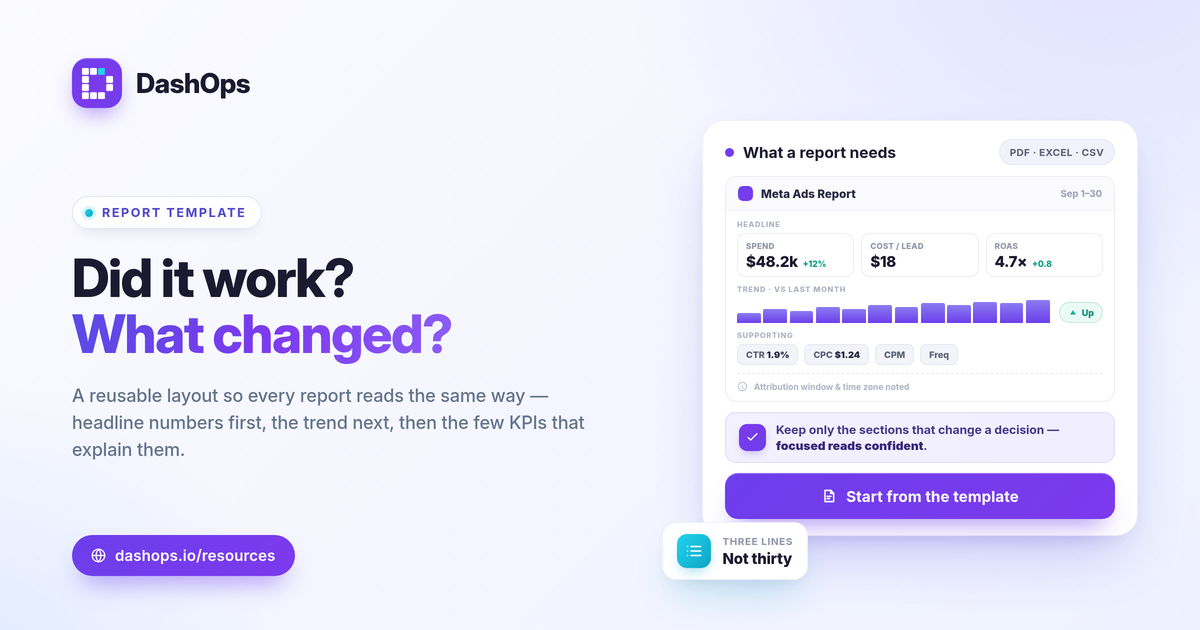
What the free template includes
The template is built around the sections a strong report actually needs, not every column Meta will hand you. Each format covers the same ground in the way that format does best.
- PDF. A polished, branded one-to-three page summary. Best for sending to a client or a stakeholder who wants the story, not the spreadsheet.
- Excel. A multi-tab workbook: an overview tab, a daily trend tab, and a campaign breakdown tab. Best when the reader wants to filter, sort, or add their own math.
- CSV. The raw rows, one line per campaign or per day, with no formatting. Best when the numbers feed a spreadsheet model, another reporting tool, or a data warehouse.
A common pattern is to send the PDF for the narrative and attach the CSV or Excel file for anyone who wants to dig in.
Start with the headline numbers
Open the report with the metrics tied to the goal. For most advertisers that is three lines, not thirty.
- Spend and results. What you spent and what you got, side by side. Results means the action you optimized for: purchases, leads, messages, installs.
- Efficiency. Cost per result. That is cost per lead for lead gen (cost per lead = spend / leads) or cost per purchase for e-commerce (cost per purchase = spend / purchases).
- Return. ROAS for sales (ROAS = conversion value / spend), or total pipeline value for lead gen.
Resist the urge to lead with impressions or reach. Those explain the headline; they are not the headline.
Show the trend, not just the total
A single total hides the story. The template includes a trend section because a period-over-period comparison answers the question the reader actually has: is this period better or worse than the last, and by how much.
- Put this month next to last month, or this week next to last week, for every headline metric.
- Add a small trend chart of daily spend against daily results so a spike or a drop is visible at a glance.
- Flag the direction with plain language. “Cost per lead down, lead volume up” tells the reader more than two raw numbers.
If you want a deeper read on which numbers belong together, the Meta Ads KPIs to track post groups all 17 by the story they tell.
Fill in the supporting KPIs
Below the headline, a short supporting set explains why the top numbers moved. Include these on the detail tab or the second PDF page.
- CTR (click-through rate). Link clicks divided by impressions (CTR = clicks / impressions). A falling CTR on a long-running ad is a fatigue signal.
- CPC (cost per link click). Spend divided by link clicks (CPC = spend / clicks). The fastest read on whether traffic is getting expensive.
- CPM (cost per 1,000 impressions). CPM = spend / impressions times 1000. A useful gauge of how competitive your audience and placements are.
- Frequency. Average times each person saw your ad. Rising frequency with falling results is the classic fatigue pattern, which you can see in the demographic and placement breakdowns the template leaves room for.
Add breakdowns only where they earn their place
The template has optional sections for demographic (age and gender) and placement breakdowns plus a top campaigns list. Use them to explain the headline, not to pad the report.
- Top campaigns. The handful of campaigns carrying the spend, ranked by the goal metric. This is where most of the “what changed” lives.
- Demographic breakdown. Where age or gender performance diverges enough to act on.
- Placement breakdown. Where one placement is quietly draining budget or quietly winning.
If a breakdown does not change a decision, leave it out. A focused report reads as more confident than a long one.
How to judge whether the numbers are “good”
The template deliberately does not print a “good” benchmark next to each metric, because a universal number would mislead you. A ROAS that is profitable for a high-margin product can be a loss for a thin-margin one. The honest way to judge is against your own goal, your own margin, and your own prior period.
- Compare each metric to your break-even, not a generic average. Break-even ROAS = 1 / profit margin is the line that matters for sales.
- Compare to last period’s trend to see direction.
- Note your attribution window and time zone on the report. If the numbers ever look off against Ads Manager, those two settings plus iOS privacy undercounting are the usual reasons, which is why the template leaves a footnote line for the attribution setting.
For more on building the report end to end versus pulling exports by hand, the Facebook Ads Manager vs reporting dashboard comparison is a useful companion.
When a template stops scaling
A template is the right starting point. It starts to cost you time once you run more than a couple of ad accounts, or once you send the same report on a schedule, because every send means re-pulling columns, re-formatting, and re-checking the date range. At that point a dashboard reads every KPI across your ad accounts in one place with period-over-period comparison built in, and exports the same report to PDF, Excel and CSV without the manual rebuild. DashOps does exactly this, including scheduled email digests and white-label client reports. See what each plan includes on the pricing page, and the help center covers setup.
Build your first report from the template, keep only the sections that change a decision, and let the layout stay the same so every report reads the same way.
Frequently asked questions
What should a Facebook Ads report template include?
Should I use PDF, Excel or CSV for my Facebook Ads report?
Why do the numbers in my Facebook Ads report not match Ads Manager?
See it in your own dashboard
DashOps brings Meta Ads reporting, campaign management, and white-label client portals into one place. Pick the plan that fits how you run ads.