Facebook Ads Benchmarks for Real Estate: CPL, CPC and CTR Agents Should Expect
There are no universal Facebook Ads benchmarks for real estate that you can copy as a target, because real estate cost per lead, CPC and CTR swing widely by market, price point, audience, objective and season. A luxury listing in a tight metro and a first-time-buyer lead magnet in a rural county will not share a number. The honest way to benchmark real estate Meta Ads metrics is to learn the formulas, understand what moves each one, and compare your current results against your own prior periods and your own economics. This guide shows how to do that and how to report it to brokerage stakeholders.
Why a single industry benchmark misleads agents
Anyone selling you one “average real estate CPL” is flattening a lot of variation into a number that may not describe your situation at all. Real benchmarks differ by:
- Market and price point. Cost in a competitive metro auction is not the cost in a quiet suburb, and seller leads rarely cost the same as buyer leads.
- Objective. A lead-form campaign, a traffic campaign and a conversion campaign optimize differently, so their costs are not comparable.
- Audience and offer. A broad home-valuation offer behaves differently from a narrow new-construction audience.
- Season. Spring listing demand and holiday slowdowns shift auction pressure across the year.
Because of that spread, the most reliable real estate lead gen benchmark is your own history. Period-over-period comparison answers the question that actually matters: is this month better or worse than last, and what changed.
The three metrics and how to read them
Use the real formulas, then judge the output against your goals rather than a borrowed figure.
- Real estate cost per lead (CPL). CPL = spend / leads. This is your headline efficiency number for lead-gen real estate. Whether a given CPL is “good” depends on your close rate and average commission, not on an industry chart.
- Real estate CPC benchmark (CPC). CPC = spend / clicks. CPC reflects how competitive the auction is for the audience you are buying. Rising CPC with flat CTR usually means more auction demand, not a worse ad.
- CTR. CTR = clicks / impressions. This is your clearest signal that the creative and audience match. A falling CTR while CPM holds steady is an early sign the creative needs a refresh.
Two supporting numbers help you interpret the three above. CPM = spend / impressions times 1000 tells you what the auction charges to reach people, and frequency tells you how often the same person is seeing your ad. When frequency climbs and CTR slides, you are likely looking at fatigue rather than a pricing problem. DashOps reports frequency, demographic and placement breakdowns alongside these metrics, which is what lets you separate a tired creative from a costlier auction. For a fuller list of what to watch, see Meta ads KPIs to track.
How to set your own real estate benchmark
Build the benchmark from your economics, not from a published median.
- Start from the deal, not the click. Work backwards: average commission times your lead-to-close rate gives you the value of a lead. That tells you the maximum CPL you can pay and still profit.
- Use break-even as a ceiling. Break-even ROAS = 1 / profit margin. For lead gen, the equivalent ceiling is the CPL at which a lead’s expected value equals its cost. Anything below that ceiling is working.
- Set a baseline from your own data. Pull a few comparable prior periods and use the range you actually saw as your reference, segmented by seller versus buyer campaigns since they rarely match.
- Watch the trend, not the snapshot. A single month’s CPL hides the story. The direction over several periods tells you whether costs are drifting up or your creative is recovering.
This is why comparing against yourself beats chasing one universal figure. Your close rate, your commission and your market define what “good” means for you. If you want the broader cross-industry version of this reasoning, how to benchmark Meta ads performance covers the same method applied beyond real estate.
What moves these metrics during the year
When a number shifts, check the cause before you change the campaign.
- Auction demand. More advertisers competing for the same audience raises CPM and CPC without anything being wrong with your ad.
- Creative fatigue. Rising frequency with falling CTR points to a worn-out creative. A placement and demographic breakdown shows where the fatigue is concentrated.
- Audience and placement mix. A broad reach push and a tight retargeting set produce very different costs, so blended averages can hide both.
- Season. Listing supply, mortgage rate news and holiday lulls all change buyer intent and therefore cost.
Reading the breakdowns instead of one blended average is how you avoid pausing a campaign that is fine and keeping one that is quietly draining budget.
Reporting these to brokerage stakeholders
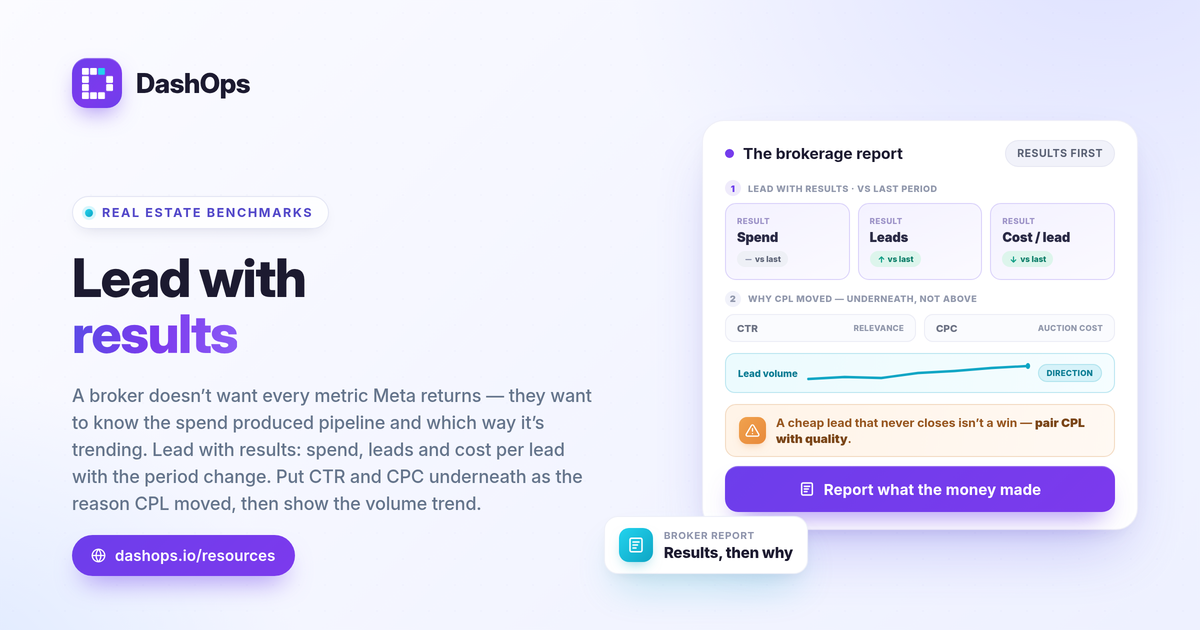
A broker or team lead does not want every metric Meta returns. They want to know whether the spend produced pipeline and which way it is trending.
- Lead with results. Spend, leads and cost per lead, side by side, with the period-over-period change.
- Add efficiency as support. CTR and CPC explain why CPL moved, so include them under the headline numbers rather than above them.
- Show direction. Lead volume trend over several periods tells the stakeholder whether things are improving, which a single month cannot.
- Note quality, not just count. A cheap lead that never closes is not a win, so pair CPL with what you know about lead quality from your CRM.
For client-facing or owner-facing delivery, white-label reporting keeps the report on your brand. See white-label client reporting for how that works, and Facebook Ads Manager vs reporting dashboard if you are deciding where to build the report in the first place.
A note on lead data: Meta only lets you download Instant Form leads directly from the Page for a limited window, around 90 days, after which leads must be pulled through the API or a connected tool. Plan your exports so a slow nurture cycle does not leave older leads stranded.
DashOps reads spend, leads, CPL, CPC, CTR, frequency and period-over-period comparison across one or many Meta ad accounts in a single dashboard, with demographic and placement breakdowns and white-label client reports, so you can benchmark against your own history and hand a brokerage a clean view. See what each plan includes on the pricing page, and the help center covers connecting your ad account and setting up reports.
The most useful real estate benchmark is not a number you found online; it is last period’s result compared honestly against this one.
Frequently asked questions
What is a good cost per lead for real estate Facebook Ads?
How do I know if my real estate CPC and CTR are healthy?
Which Meta metrics should I show a brokerage stakeholder?
See it in your own dashboard
DashOps brings Meta Ads reporting, campaign management, and white-label client portals into one place. Pick the plan that fits how you run ads.