Facebook Ads Benchmarks for Healthcare and Dental Practices: CPL and CPC by Service
Honest Facebook Ads benchmarks for healthcare and dental practices do not come as a single median you can paste into a slide. Costs swing too widely by service line, location, audience, and season for one universal number to mean anything for your clinic. What you can do is learn the real formulas, understand what moves cost per lead and cost per click for each service you advertise, and judge your results against your own prior periods and case economics. This guide explains how to think about CPL and CPC by service line for medical and dental practices, and how to report patient lead costs in a dashboard so the people who read it trust the numbers.
Why there is no single healthcare benchmark number
Meta runs an auction, and the price you pay reflects who else is bidding for the same attention at the same moment. A cosmetic dentistry offer in a dense metro competes against a different field than a rural family practice running a new-patient checkup campaign. That alone makes any published “average” misleading.
The factors that move healthcare Meta Ads metrics include:
- Service line and case value. Implants, orthodontics, and cosmetic procedures behave nothing like a routine cleaning or a flu-shot reminder.
- Geography and competition. Dense, high-income areas tend to see more auction pressure than thinly served regions.
- Audience size and targeting. Narrow local radius targeting prices differently than broad reach.
- Objective. A lead-form campaign, a click-to-website campaign, and a call campaign produce different CPC and CPL math.
- Season and demand. Back-to-school orthodontic interest or year-end benefit deadlines shift demand within a year.
- Creative and offer. A clear consultation offer with strong creative lowers cost; a vague ad raises it.
Because all of these vary by practice, a medical practice ad benchmark borrowed from someone else is a starting hypothesis at best. The reliable benchmark is your own trend.
The formulas that actually define CPL and CPC
You do not need a dataset to benchmark yourself. You need the formulas and your own numbers.
- CPC = spend / clicks. What you pay for a click to your site or landing page.
- CPM = spend / impressions times 1000. The cost to reach a thousand impressions, useful for gauging auction pressure.
- CTR = clicks / impressions. How compelling the ad is to the audience seeing it.
- Cost per lead = spend / leads. The headline number for any lead-gen practice.
- Break-even ROAS = 1 / profit margin. For practices that can attach revenue, this tells you the return you need to clear before profit begins.
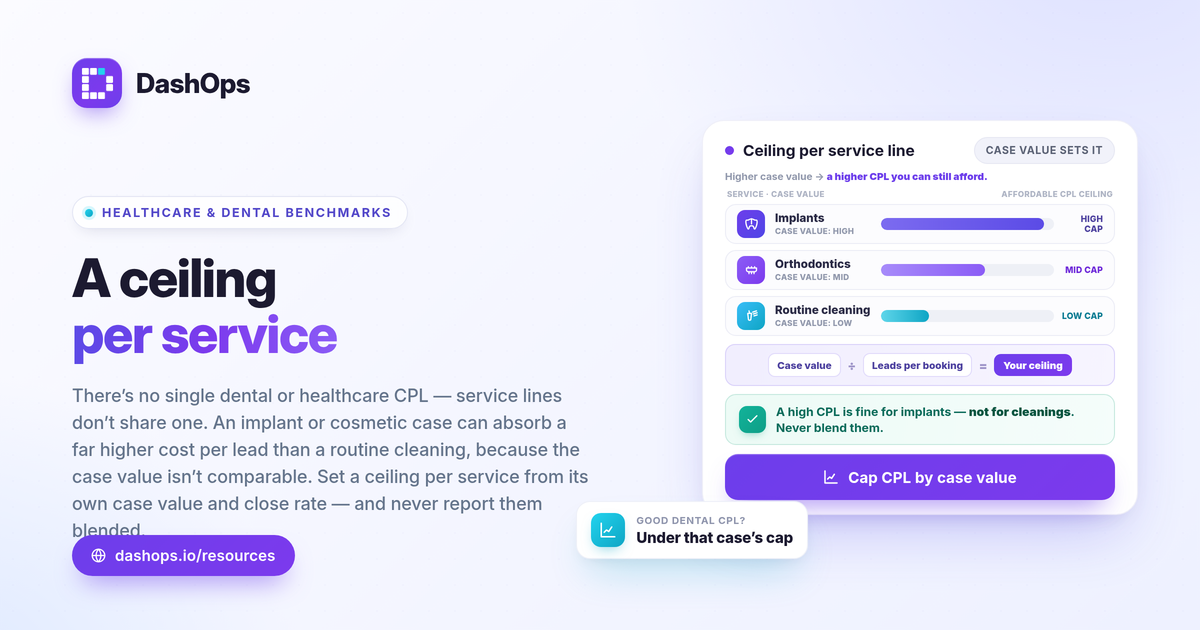
For dental Facebook Ads cost per lead specifically, the right target is the one that still leaves margin after your average case value and your consultation-to-booking rate are applied. A practice that closes one implant case from ten leads can absorb a far higher clinic cost per lead than a practice selling routine cleanings, because the case value is not comparable.
How to set a target CPL per service line
Work backward from economics, not from a number you read online.
- Take the average value of a booked case for that service.
- Estimate how many leads it takes to book one case from your own history.
- Divide the value you can afford to spend acquiring a patient by the leads per booking. That is your ceiling cost per lead for that service.
- Compare your live CPL to that ceiling, and to last period, every time you report.
This is why two service lines in the same practice should not share one target. A high-value cosmetic line and a low-value hygiene line have different ceilings, and reporting them together hides which one is working.
Reporting patient lead costs in a dashboard
Once you have per-service targets, the report should make direction obvious. Pull the metrics tied to the goal, not every field Meta returns.
- Spend and leads, side by side, per campaign or service line.
- Cost per lead, compared to the prior period so the reader sees whether it improved.
- CPC and CTR, to explain why CPL moved when it does.
- Demographic and placement breakdowns, to see which age, gender, or placement is driving cheaper or more expensive leads. For dental and medical offers this often reveals where budget is wasted.
- Frequency, watched as a trend, to catch creative fatigue before cost climbs.
A single total tells a stakeholder nothing. A period-over-period comparison answers the question they actually have: is this month better or worse than last, and why. That comparison is the honest way to benchmark a healthcare account, because it measures you against your own past instead of a stranger’s median. For a fuller list of what to surface, see Meta ads KPIs to track.
Cost per lead is only half the story
A cheap lead that never books is not a win. Healthcare and dental practices live and die on lead quality, so the report should not stop at cost per lead. Once you know which leads scheduled and which showed, feed that back into the picture and judge each service line on cost and quality together. A higher cost per lead that books real consultations can beat a flood of cheap form fills that go nowhere.
One platform detail matters here. Meta only lets you download Instant Form leads directly from the Page for a limited window, about 90 days, after which leads must be retrieved through the API or a connected tool. If your follow-up and reporting depend on that data, export it on a regular cadence so it is captured before the window closes.
Keep iOS undercounting in mind
Conversions reported by Meta can undercount because of iOS privacy changes and signal loss, which means some bookings tied to your ads may not show in the platform. Treat Meta-native numbers as the in-platform view, reconcile them against your booking system where you can, and avoid declaring a service line dead on a metric that may be understated.
Bringing it together with DashOps
If you run more than one practice location or several ad accounts, gathering spend, leads, and cost per lead into one place saves real time. DashOps reads your Meta KPIs across ad accounts in a single dashboard with period-over-period comparison built in, adds demographic and placement breakdowns, and exports Instant Form leads to CSV or Excel so they are captured before the 90-day window closes. You can share a read-only or white-label client report so practice owners and stakeholders see the same numbers without a Meta login. See what each plan includes on the pricing page, and the help center covers setup. For how a dashboard differs from raw Ads Manager, see Facebook Ads Manager vs a reporting dashboard.
The practical takeaway: skip the hunt for one universal healthcare benchmark and set a CPL ceiling per service from your own case value, then track it against last period every time you report.
Frequently asked questions
What is a good cost per lead for dental Facebook Ads?
Why do my Facebook Ads benchmarks differ so much from another clinic?
How should a practice report patient lead costs to stakeholders?
See it in your own dashboard
DashOps brings Meta Ads reporting, campaign management, and white-label client portals into one place. Pick the plan that fits how you run ads.